4.1. Precipitation processes#
4.1.1. Precipitation and the Earth’s water and energy cycles#
Precipitation (NL: neerslag) can be defined as all water (solid or liquid) falling from the atmosphere and reaching the continents and oceans. It plays a central role in the water and energy cycles driving the Earth’s climate system. First of all, precipitation constitutes the main source of water for the terrestrial hydrological processes (interception, runoff, infiltration, evaporation). In addition, its spatial and temporal variability is a key factor in determining the appearance and functioning of the terrestrial biosphere (ecosystems, agriculture). Because precipitation is the main source of freshwater over the oceans, it also plays an important role in forcing the thermohaline circulation (the large current through the oceans around the world, which is driven by temperature and salinity differences).

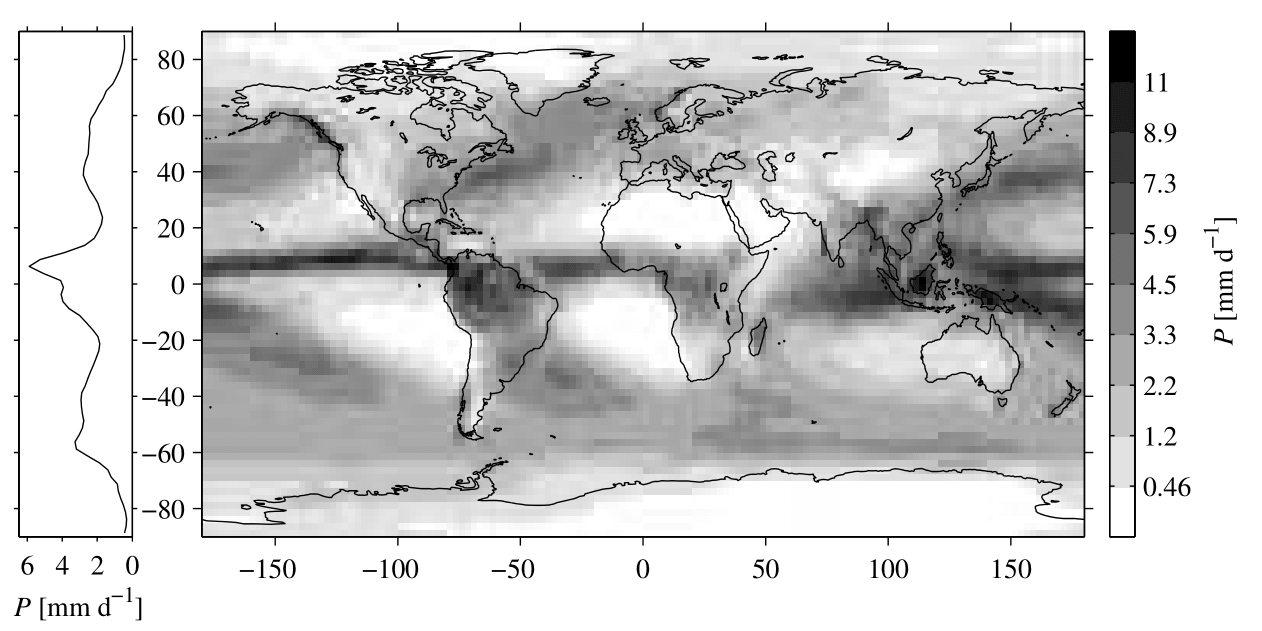
Fig. 4.2 Global rainfall climatology (1979-2008) from the Tropical Rainfall Measuring Mission (NASA GPM Mission, 2015) and other sources as computed by the Global Precipitation Climatology Project (UCAR Climate Data Guide, n.d.) - Retrieved from (Metselaar et al., 2022).#
The global average annual precipitation is about 1 m (1000 mm). However, precipitation is highly variable in space and time, both at local and at global climatic scales (Fig. 4.2). The zonal (latitudinal) distribution of yearly rainfall shows a typical pattern, with an absolute maximum around the equator, associated with the Intertropical Convergence Zone (ITCZ), and secondary maxima over the northern and southern hemisphere midlatitudes, associated with frontal weather systems. Yearly precipitation over the equatorial regions of South America, Africa, Indonesia and over the western equatorial Pacific may exceed 3 m. The intermediate zones in the sub-tropics, with their semi-permanent anticyclones, exhibit a significantly lower than global mean annual precipitation (i.e. less than 0.2 m), whereas over the polar regions, where the available atmospheric moisture contents are very small, the amounts of precipitation are lowest. A significant portion of the continental subtropics is desert (Africa, Australia), where mean annual precipitation is also very low.
There is a pronounced yearly cycle in the zonal distribution of precipitation over the globe: as the ITCZ, which acts as the thermal equator, migrates north and south in phase with the seasonal solar insolation cycle, the equatorial precipitation maximum moves with it. The arid climates of regions such as the Sahel in Africa are located exactly in the latitudinal belt over which this ITCZ migration takes place. Both the amplitude of the zonal precipitation distribution and the magnitude of its seasonal shifts are more pronounced over the continents than over the oceans. At individual locations there can be significant deviations from the zonal means reported hitherto. Locally collected (i.e. point) annual average precipitation totals range from more than 13 m to less than 0.001 m. Certain dry valleys in the interior of Antarctica are thought to have not received any precipitation during the last two million years.
The global average precipitable water column in the atmosphere is only about 25 mm. This is the amount of water that would reach the Earth’s surface if all the water vapor in the entire atmospheric column were to condense and precipitate at a given moment. Of course, heavy rain storms are able to deposit significantly larger amounts of rain locally. This illustrates that it is not so much the available precipitable water controlling the local intensity and total amount of precipitation being released, but the horizontal influx (advection) of moist air into an area. The exact manner in which this takes place depends on the type of weather system as well as on the local topography.
Dividing the global mean precipitable water column of 25 mm by the global mean annual precipitation of 10\(^3\) mm (i.e., 2.7 mm of precipitation per day on average) yields an average residence time of water molecules in the atmosphere of about nine days (assuming perfect mixing). This is by far the shortest residence time of all the Earth’s water reservoirs, making the atmosphere the fastest responding reservoir of all. Being intimately related to the occurrence of precipitation, the amount of precipitable water shows a distinct zonal dependence as well, with the largest amounts over the equatorial regions and the smallest amounts over the poles. This dependence is strongly controlled by the temperature-dependence of the saturation water vapor pressure of air, as dictated by the Clausius-Clapeyron equation (equation (4.1)). As a result of the pronounced temperature difference, the saturation vapor pressure is an order of magnitude larger near the equator than over the poles. The same effect also controls the vertical distribution of water vapor in the atmosphere (strongly decreasing with altitude).
A very good approximation of the Clausius-Clapeyron equation is given by the August-Roche-Magnus formula (also referred to as Magnus or Magnus-Tetens approximation):
With:
\(e^* (T)\) |
Saturation vapor pressure (or equilibrium) |
[M/LT\(^{2}\)] |
[hPa] |
\(T\) |
Temperature |
[Celsius] |
in which \(e^* (T)\) is the equilibrium or saturation vapor pressure [hPa], and \(T\) is temperature [Celsius].
Precipitation is more than merely a mass flux affecting the water budget of the Earth’s surface. The release of latent heat as a result of the condensation of water vapor that is required to produce precipitation constitutes an important component of the atmosphere’s energy budget and is therefore an important driver for the atmospheric circulation. To illustrate this, recall that the global mean annual precipitation is about 1 m. Combining this with the latent heat of vaporization of water (~ \(2.5\cdot10^6\) J/kg) shows that the 10\(^3\) kg of precipitation reaching the average square metre of the Earth’s surface on a yearly basis corresponds to a mean latent heat flux of the order of 80 W m\(^{-2}\). A comparison with the mean net incoming solar radiation (incoming shortwave radiation minus outgoing shortwave radiation, ~240 W m\(^{-2}\)) clearly shows that the latent heat release associated with precipitation production is an important term in the energy budget of the atmosphere. The release of energy through condensation and subsequent precipitation is the largest single heat source for the atmosphere (Brutsaert, 2005). In arid environments, part of this released energy may be consumed for evaporation of raindrops on their way from the cloud base to the ground. Recent satellite-based estimates show that typically 20% of the rainfall from convective clouds over the tropical oceans may evaporate, with maxima up to 50%.
Exercise 4.1
Fig. 4.3 shows the distribution of global precipitation with latitude. Which letter indicates the Intertropical Convergence Zone?

Fig. 4.3 Latitudinal distribution of precipitation. Global rainfall climatology (1979-2008) from the Tropical Rainfall Measuring Mission (NASA GPM Mission, 2015) and other sources as computed by the Global Precipitation Climatology Project (UCAR Climate Data Guide, n.d.) - Retrieved from (Metselaar et al., 2022).#
Answer Exercise 4.1
The ITCZ is the area encircling the Earth near the equator where winds originating in the northern and southern hemispheres meet. On satellite images it can be recognized as a band of clouds, usually thunderstorms, that circle the globe near the equator and cause large rainfall accumulations. This latitudinal band, moving north and south with the seasons, is indicated by the letter b.
4.1.2. Cloud formation and precipitation production#
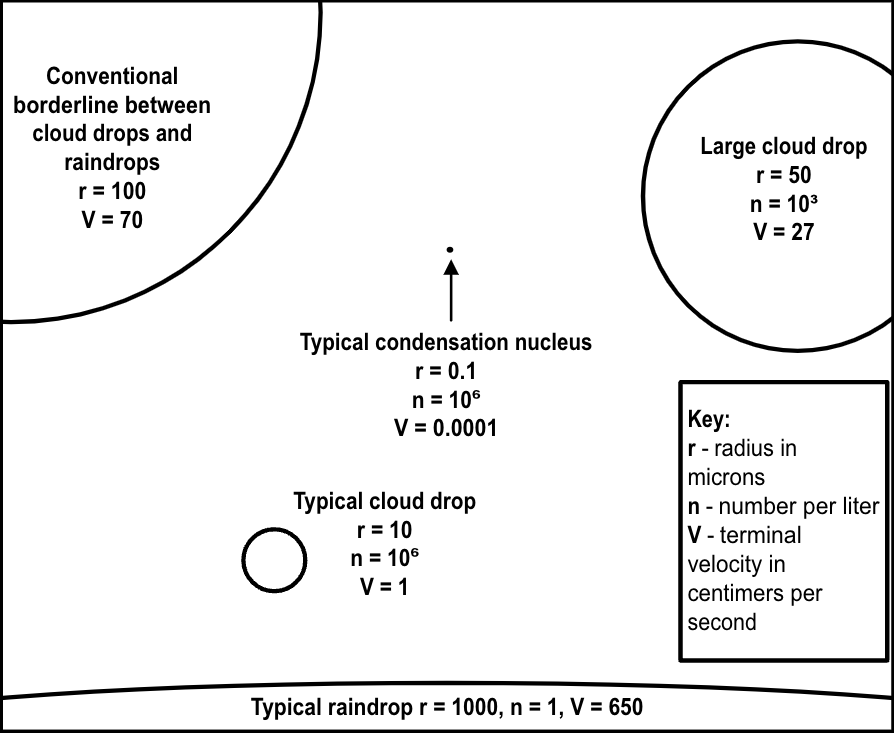
Precipitation is the flux of hydrometeors from the atmosphere to the Earth’s surface. All liquid or solid water particles in the air are called hydrometeors, from the smallest cloud droplets and ice crystals to the largest precipitation particles, including raindrops, snow flakes and hail stones (Fig. 4.4). The ingredients necessary for cloud droplets to form are water vapor and aerosols (e.g., dust, smoke, and sea salt), acting as cloud condensation nuclei. If the air surrounding the aerosols has reached a certain amount of supersaturation (\(e>e^*\)) – a few percent is generally enough – then small cloud droplets will be created by a process called heterogeneous nucleation. In the absence of cloud condensation nuclei the process would be called homogeneous nucleation, but since this would require a supersaturation in excess of 200%, it does not play a role in cloud formation.

Fig. 4.4 Radius, concentration and terminal fall speed of cloud droplets and raindrops – Adapted from (Shaw, 1993).#
The cloud droplets will be stable once they have reached a certain critical size. This size is determined by the balance of the two opposing processes of condensation and evaporation. Because (according to Thomson’s formula) the saturation vapor pressure over curved surfaces of pure water increases with decreasing radius of curvature, the smaller the droplet, the greater the supersaturation required for equilibrium. The effect of dissolved substances (e.g., sea salt) in the water droplet is that they tend to decrease the saturation vapor pressure with respect to that of a droplet of the same size consisting of pure water. According to Raoult’s law, this reduction is more pronounced for small droplets than for larger ones. The combined effect of curvature and solutes (Köhler’s curve) yields a critical size beyond which a cloud droplet will remain stable even if the degree of supersaturation decreases. This critical size separates the (smaller) activated cloud condensation nuclei from the (larger) cloud droplets.
According to the Clausius-Clapeyron relation, the saturation water vapor pressure of air decreases with decreasing temperatures. Therefore, supersaturation can be achieved by cooling. Although advection or radiative cooling can sometimes play a role in the formation of fog or light drizzle, the amount of cooling required for cloud and precipitation formation is mostly achieved through lifting, for instance due to the presence of a front, convection, or orography. Slow lifting over larger areas is associated with stratiform cloud and precipitation formation, whereas rapid lifting over smaller areas is associated with convective cloud and precipitation formation. Heavy convective precipitation is often accompanied by electrical discharges (lightning), which requires the presence of both liquid water droplets and ice particles in the cloud.
In a cloud of sufficient vertical extent different temperature zones can be distinguished. The lowest region, where temperatures are above \(0^\circ\)C, contains small cloud droplets only. Supercooled cloud droplets are present in the region where temperatures are between \(0^\circ\)C and \(-10^\circ\)C. Even higher in the cloud, where temperatures are between \(-10^\circ\)C and \(-23^\circ\)C, supercooled cloud droplets and ice crystals co-exist. Finally, the top of convective clouds, where temperatures drop below \(-23^\circ\)C, consists of ice crystals only. As an example, Fig. 4.5 shows a vertical cross-section through a stratiform precipitating cloud, as observed using weather radar. The dark grey colours indicate mostly frozen hydrometeors, the lighter colours between 1 and 2 km indicate the radar ‘bright band’ caused by the enhanced radar reflectivity associated with the melting layer, and the slightly darker colours below the melting layer indicate liquid precipitation (light rainfall). The onset of melting just above the bright band is an indication of the height of the \(0^\circ\)C-isotherm, which in this case is located at an altitude of approximately 2 km.

Fig. 4.5 Vertical cross-section through a stratiform precipitating cloud observed by the former KNMI weather radar in De Bilt, The Netherlands, on 31 March 2011 8:30 UTC - Retrieved from (Metselaar et al., 2022).#
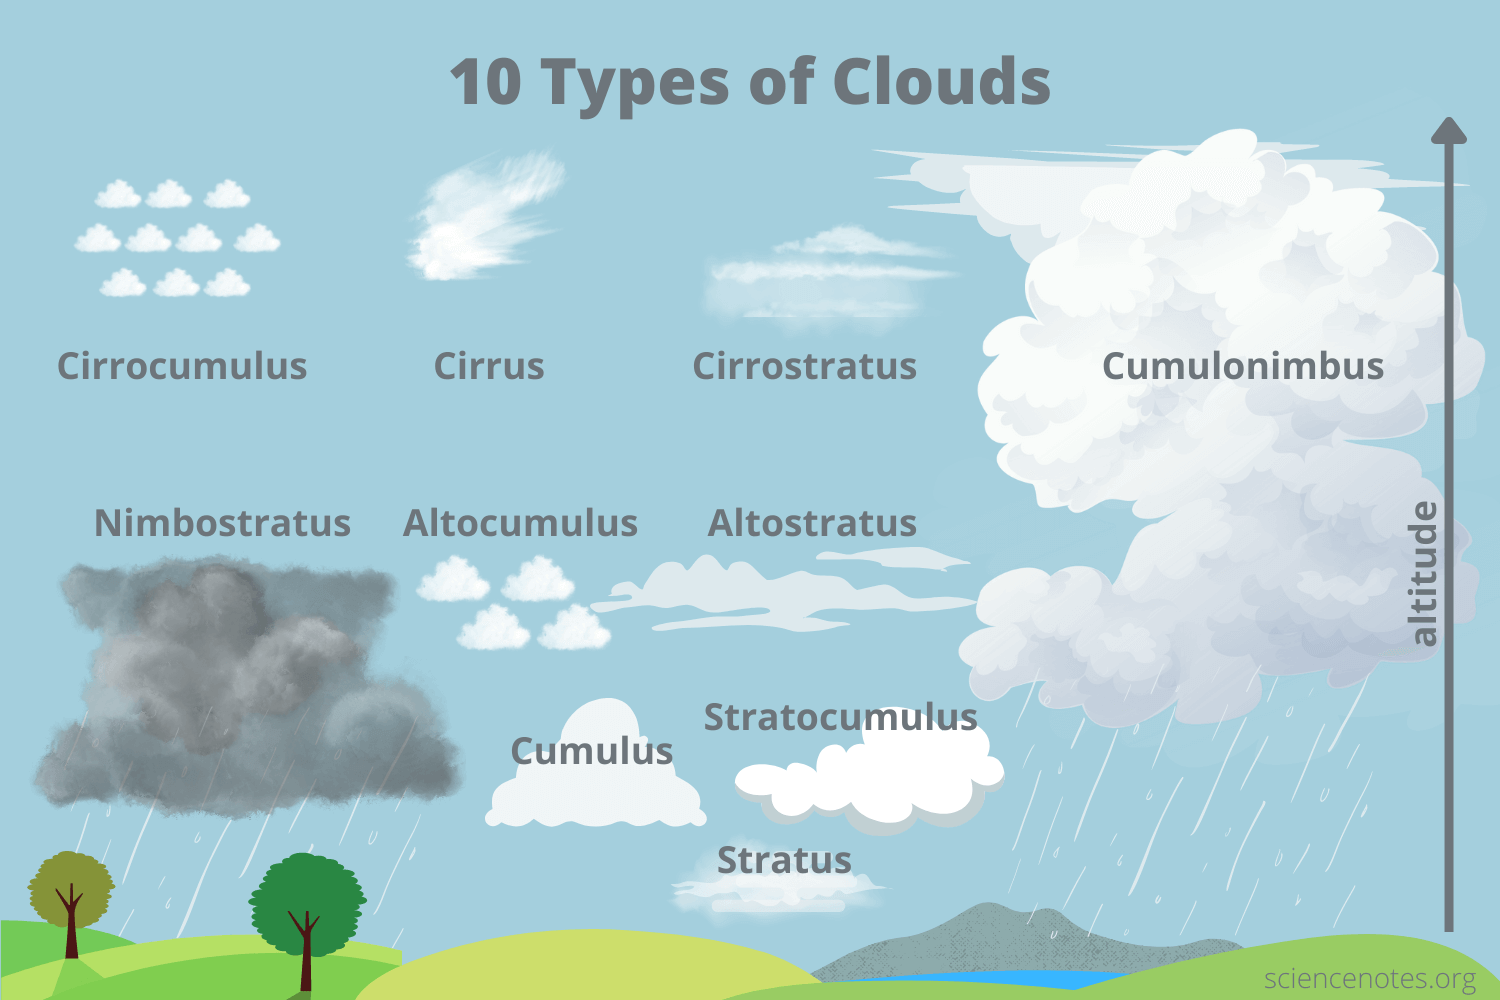
Depending on their appearance, clouds fall into four general classes:
Cumulus clouds are associated with convection, have a heaped structure with a large vertical and limited horizontal extent;
Stratus clouds have a layered structure with a large horizontal and limited vertical extent;
Cirrus clouds with their hairy or feather-like appearance are located high in the atmosphere and consist of ice crystals;
Nimbus clouds indicate that a cloud produces precipitation.
Various combinations of these names are used in meteorology to describe particular cloud types (see Fig. 4.6).

Fig. 4.6 Types of clouds (Helmenstine, n.d.).#
Two mechanisms of precipitation formation can be distinguished, the so-called warm rain process (occurring only for cloud temperatures exceeding \(0^\circ\)C) and the cold rain process (where both liquid and frozen hydrometeors are involved). Warm rain formation is based on the collision-coalescence process, where larger (faster) collector drops grow by colliding and coalescing with smaller (slower) droplets. An important factor determining the size to which a collector drop is ultimately able to grow is the time required by such a drop to fall through the cloud while colliding and coalescing with smaller droplets. In stratiform clouds, with a limited vertical extent, there is relatively little time available for larger drops to collect smaller droplets. As a result, raindrops produced by stratiform clouds tend to be relatively small. In convective clouds, which have a large vertical extent and significant upward air motions within the cloud (updrafts), there is much more time available for collector drops to grow at the expense of the smaller cloud droplets. Hence, raindrops produced by convective clouds tend to be larger than those produced by stratiform clouds.
The sizes of raindrops arriving at the ground, however, will generally be different from those leaving the cloud base, as they may be affected by processes such as evaporation, condensation and collisional break-up. The importance of these processes depends on the size distribution of the drops leaving the cloud base, the height of the cloud base above the ground, and the ambient meteorological conditions (in particular air temperature and humidity).
The process of cold rain production or the Bergeron-Findeisen process, after the scientists who first described and verified the mechanism, occurs in clouds with temperatures significantly below freezing level (where cloud top temperatures are below \(-15^\circ\)C), in which ice crystals co-exist with large numbers of supercooled water droplets. Because the saturation water vapor pressure over ice is smaller than that over liquid water at the same temperature, saturated water vapor that is in equilibrium with supercooled water droplets will be supersaturated with respect to ice crystals. The result is a net transport of water vapor from cloud droplets to ice crystals. In other words, ice crystals will grow at the expense of cloud droplets, which evaporate.
The growing ice crystals will start to accelerate, causing collisions with other hydrometeors. If these collisions are mainly with other ice crystals, snow flakes will be created. If the collisions are mainly with supercooled water droplets, hail stones (NL: hagel) or graupel (heavily rimed snow particles, often called snow pellets) will be formed. Once the falling particles pass the \(0^\circ\)C-isotherm, melting will commence and the (partly) frozen hydrometeors will transform into raindrops. Depending on the temperature below the cloud base and the height of the cloud base above the ground, different types of precipitation may reach the Earth’s surface: rain, snow, hail, graupel, supercooled rain, or combinations thereof. The main focus of the remainder of this chapter is on rain, which is very relevant from a (global) hydrological perspective.
4.1.3. Precipitation and climate change#
Although it is currently well-established that increased greenhouse gas concentrations play an important role in the observed and projected global increase in mean surface air temperature, the effects of global change on current and future precipitation occurrence and patterns are significantly less clear. This uncertainty is due to the complexity of the precipitation process itself, with its enormous variation in space and time, both at global, regional and local scales, and due to the not yet fully understood role it plays in several feedback mechanisms in the climate system (Stainforth et al., 2005). This makes precipitation a notoriously difficult geophysical field to model and to measure.
The Clausius-Clapeyron relation predicts that rising air temperatures will lead to increases in the saturation water vapor pressure of the atmosphere. Assuming that the relative humidity (\(e/e^* \cdot 100 \%\)) would remain relatively constant, an assumption for which observational evidence exists (Allen and Ingram, 2002), predicted temperature increases associated with global change can therefore be translated into increases in specific humidity relatively easily. Such increases have indeed been observed in the northern hemisphere. On the basis of simulations with atmosphere-ocean general circulation models, Allen and Ingram (2002) argue that precipitation cannot be expected to increase accordingly, because changes in the overall intensity of the hydrological cycle are not controlled by the availability of moisture, but by the availability of energy, in particular the ability of the troposphere to radiate away the latent heat released by precipitation.
Analyses of satellite observations, however, suggest that precipitation and total atmospheric water have increased at about the same rate over the past decades (Wentz et al., 2007). Moreover, from a comparison of climate model simulations with observed changes in the zonal precipitation distribution over land during the twentieth century, Zhang et al. (2007) conclude that anthropogenic forcing has contributed significantly to observed precipitation increases in the Northern Hemisphere mid-latitudes, drying in the Northern Hemisphere subtropics and tropics, and moistening in the Southern Hemisphere subtropics and deep tropics. On the basis of climate model simulations, others argue that global warming will lead to an enhanced seasonality in tropical precipitation (i.e., an increased range between rainy and dry seasons) and an increased asymmetry of tropical precipitation between the Northern and the Southern Hemispheres.
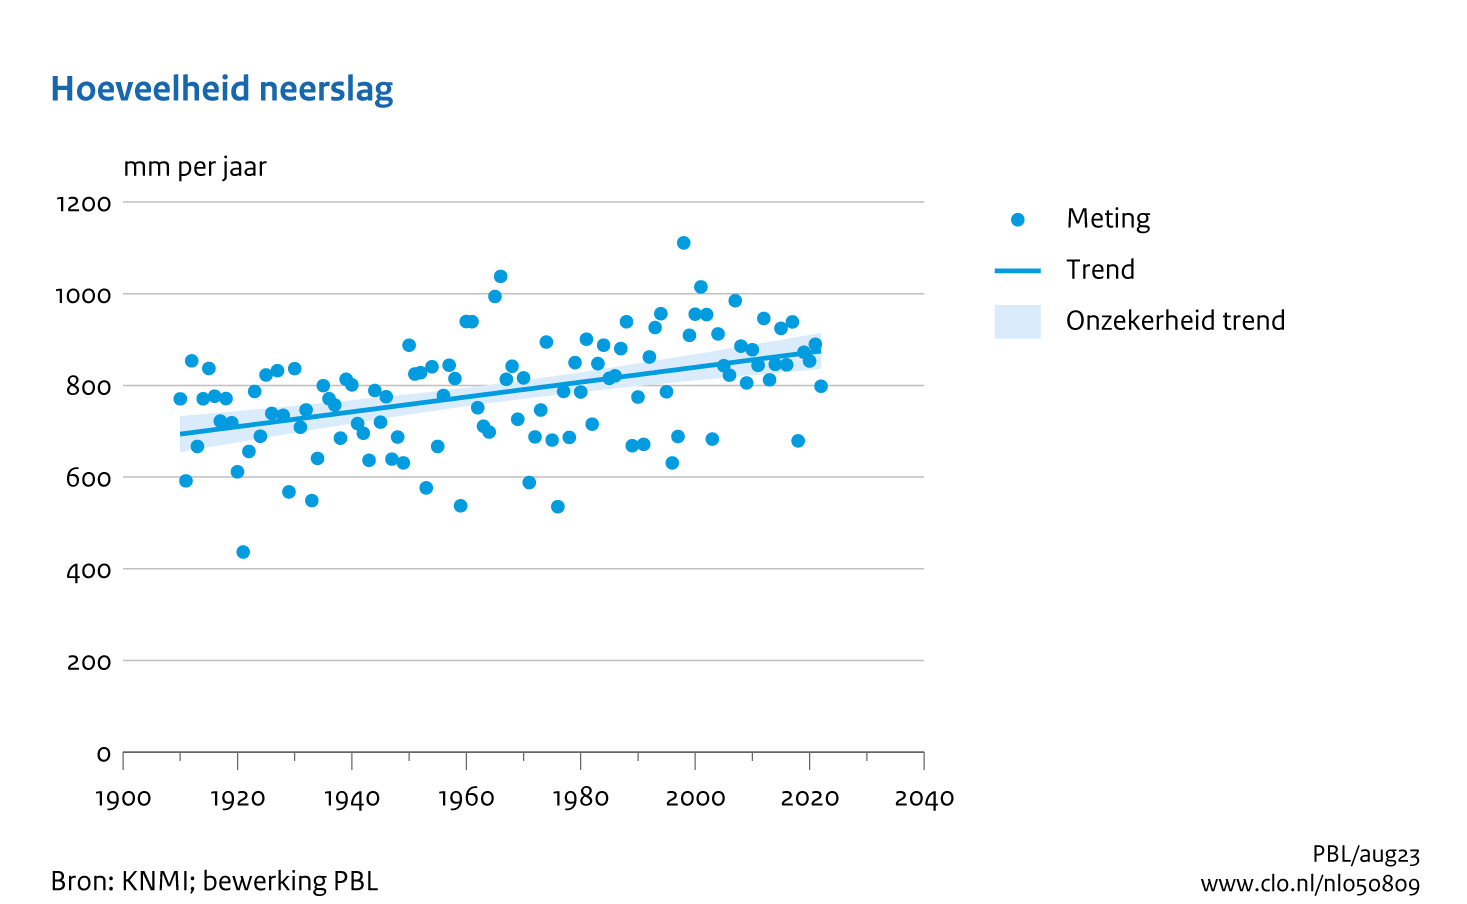
The yearly precipitation amount in the Northern Hemisphere mid-latitudes increased by 5–10% during the 20\(^\mathrm{th}\) century (see Fig. 4.7). The occurrence of extreme precipitation in Europe, as quantified by the number of days with rainfall amounts exceeding 20 mm, has increased over the past six decades. In the Netherlands, yearly precipitation has increased on average by 26% since 1910 (continuous observations began in 1906). This increase can mainly be attributed to enhanced precipitation during winter, spring and autumn; summer precipitation has increased only very little. Multi-day rainfall totals during winter have increased as well: the yearly maximum 10-day rainfall total has increased by about 30% since 1906. There is no clear trend in extreme precipitation during summer (KNMI, 2023). This is in line with an analysis of a time series of more than 100 years of 10-min rainfall amounts from Uccle, Belgium, reporting a small increase in winter rain rates and rain amounts since the 1990s, but no clear trend during summer (Willems et al., 2007). Apart from what appears to be an effect that could be attributed to climate change, these authors also found a multi-year periodicity in the occurrence and amount of extreme rainfall. As far as the expected changes in the precipitation climatology for the Netherlands during the 21\(^\mathrm{st}\) century are concerned, winters are thought to become more humid, with increased extreme precipitation amounts. The intensity of extreme rain events during summer is expected to increase, combined with a decrease in the total number of rainy days (KNMI, 2023).

Fig. 4.7 Annual rainfall sums (blue dots) in the Netherlands from 1910 to 2022 (mean of 102 stations). The blue line indicates the trend over 113 years (with uncertainty) – Data from (KNMI / PBL).#
A specific example of the human influence on observed precipitation trends, other than that related to increased greenhouse gas concentrations, concerns the observed decrease of orographic precipitation over the past six decades near Xi’an (central China) associated with increased amounts of air pollution. Enhanced concentrations of aerosols (acting as cloud condensation nuclei) lead to clouds with smaller droplets, which grow slower into raindrops or frozen hydrometeors, thus suppressing the formation of precipitation. This example demonstrates that there does not only seem to be a human influence on the occurrence and amounts of precipitation, but also on its microphysical structure. This secondary effect could potentially have an indirect influence on the hydrological cycle too, for instance through the role of rainfall microstructure in rainfall interception by vegetation canopies. Parameterizations for the hydrological process of rainfall interception have been incorporated into climate models (Dolman and Gregory, 1992).
