5.2. Measuring evaporation#
There are various methods to measure evaporation. They can be classified into two categories: methods that are based on the water balance or those that make use of micro-meteorological techniques. Depending on the spatial and temporal scale a method can be more or less suitable. In Fig. 5.7 an overview is given. In general, you can say that the water balance methods work well at either the larger catchment scale or at the smaller spatial scales (m\(^2\) to hectares). While the micro-meteorological methods nicely fill the gap between the hectare to km\(^2\) scale. In the temporal domain, the micro-meteorological methods perform better at time scales less than a day, while the water balance methods can expand to the yearly scale.

Fig. 5.7 Space-Time. (Own work)#
5.2.1. Water balance techniques#
5.2.1.1. Catchment water balance#
Via the water balance we can estimate the total evaporation of a catchment:
Precipitation (\(P\)) and river discharge (\(Q\)) measurements are frequently available, especially at large time scales (monthly, yearly). On the other hand, data on storage changes is more difficult to obtain. These storage changes can include:
Surface water: changed water levels, readable on level gauge;
Groundwater: changed groundwater levels, readable in monitoring wells. The increase in groundwater storage is equal to the increase in the groundwater level multiplied by the storage coefficient;
Soil moisture: increase in soil moisture content, determined by sampling or with a neutron probe. Hence information on all these components is required, which is often not the case. Therefore the catchment water balance approach is often only used at the yearly time scale because then the storage change can be neglected (\(\textrm{d}S/(\textrm{1 year}) \approx 0\)). The water balance then simplifies into \(E=P-Q\). It is important to realize that the error that arises with this calculation method is a summation of errors in the measured variables.
5.2.1.2. Lake water balance#
Also for lakes the water balance method can be applied if the inflow (\(Q_{in}\)), outflow (\(Q_{out}\)), and water level (\(h\)) are measured:
Although the method can give useful information, its weakness lies in the uncertainties caused by leakage losses that are difficult to estimate. Hence additional measurements are always needed for good lake evaporation estimates, for example, the class-A pan.
5.2.1.3. Pan evaporation#
The most straightforward method to measure open water evaporation directly is with a pan (Fig. 5.8). The pan is filled with water and every time interval (e.g., daily) the water level is measured. The drop in the water level divided by the time interval gives the rate of open water evaporation. Of course, the water level difference should be compensated for rainfall. Therefore, next to the pan, a rain gauge should be installed.
Various types of pans are in use, such as the sunken pan, floating pan and surface pan. The use of the surface pan is most widely spread, despite its shortcomings. The most common is the U.S. Weather Bureau Class A-Pan, with a diameter of 4ft and depth of 10 inches. The water level is maintained 2-3 inches below the rim (Fig. 5.8).
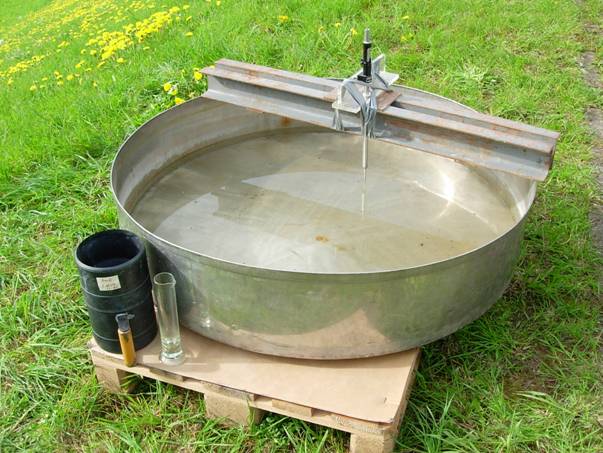
Fig. 5.8 Class A evaporation pan - photo from (TU Delft, 2022).#
Class A-pans are also used to estimate the potential evaporation over land mainly for irrigation purposes. Then the pan is installed in the field and it is assumed that \(E_o \approx E_p\).
Although the Class A-pan is a direct method, one should be careful with assuming that the pan evaporation is an estimate for the open water evaporation. Often the pan evaporation is higher than the open water evaporation due to the warming of the sides by the sun. The shallow pan reacts much faster to temperature changes than deep water. To reduce this effect the pan can be installed on floats in a lake or one can make use of correction factors (see e.g., Grismer et al. (2002) for an overview).
To correct this, empirical pan coefficients have been entered:
Coefficients are mainly derived for the American class-A pan. The values of the pan coefficients can vary widely for different circumstances. However, the average monthly evaporation values determined with the evaporation pan, give a maximum error of about 10. Data about evaporation in pans are always valuable for comparing the evaporation at different places and times.
5.2.1.4. Lysimeters#
One of the oldest and most straightforward ways to measure evaporation is with lysimeters. Lysimeters make use of the mass balance, whereby the known in- and outgoing fluxes and the storage are measured. Rainfall, percolation and soil moisture should often be measured to determine the evaporation (mass balance). The soil moisture can be measured with soil moisture probes but in the case of so-called weighing lysimeters (Fig. 5.9) the water storage can be determined by the weight changes of the lysimeter. Often load cells are used to weigh the lysimeter.
Lysimeters can measure different types of evaporation, depending on the material inside the lysimeter. Forest floor interception can be measured with a lysimeter by filling it with forest floor material (Gerrits et al., 2007). And total evaporation can be determined by filling the lysimeter with vegetation and a soil layer. Open water evaporation can be estimated by filling the lysimeter with water (the lysimeter is hydrologically isolated so the leakage loss \(ε\) = 0). So a pan is also a lysimeter.
The advantage of lysimeters is that they are conceptually simple, accurate, and have a fast time response (Gash and Shuttleworth, 2007). Disadvantages are that the edges of the lysimeter can disturb the measurements (altering the wind flow paths, roots, heat source, etc.) and that the soil and vegetation sample will be disturbed (Pruitt and Angus, 1960). One should also take care that the soil moisture inside the lysimeter is similar to the surroundings. With pumps, this can be accomplished. Furthermore, lysimeters often have a small spatial sample and especially large lysimeters are expensive to construct. Due to these high costs large lysimeters are currently not often used anymore, although they provide accurate (actual) evaporation results.
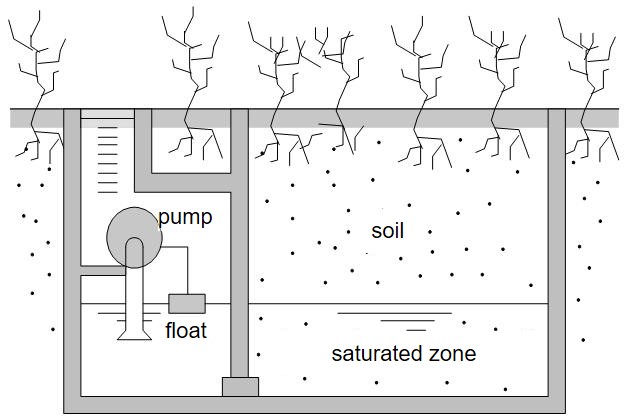
Fig. 5.9 Lysimeter - photo from (TU Delft, 2022).#
Lysimeters are applied:
To determine the evaporation term \(E\) in the water balance for a specific area;
To determine the influence of evaporation on the depth of the groundwater level, the soil condition, or the crop;
To determine the drainage, the replenishment of the groundwater or useful precipitation;
To determine condensation and dew (only possible due to weighing);
To study the chemical composition of the drained water in connection with the uptake and deposition of substances in the soil.
One of the largest lysimeters worldwide are the Davis lysimeters of the University of California (Pruitt and Angus, 1960) which are still operational, and the lysimeters in Castricum (The Netherlands). Although the lysimeters in Castricum are not operational anymore, in 2011 they digitalized all the data from the four 25x25x2.5 meter lysimeters filled with bare soil, dune scrubs, deciduous, and pine. This data is freely available and can be used for research. Currently, three new large lysimeters (30 x 12 m) are built by the University of Arizona to investigate the effect of climate change on vegetation. The lysimeters are constructed in a greenhouse facility where they can control the environment.
5.2.2. Micro-meteorological methods#
Micrometeorological methods refer to methods in which evaporation is measured as vertical vapor flux through the air. The evaporation can take place from open water, soil or vegetation. The measurements are made in the turbulent air close to the ground. So the measured vapor flux is a good approximation of surface evaporation.
5.2.2.1. Eddy Covariance System#
The eddy covariance (or eddy correlation) method measures vertical turbulent fluxes within the atmospheric boundary layer to estimate evaporation. The method requires turbulence in the air so that a horizontal wind flow consists of numerous rotating eddies (turbulent vortices of various sizes) with each eddy having horizontal and vertical components (see Fig. 5.10). The eddies transport an entity of interest. This can be heat, water vapor or gases (Burba, G. and Anderson, D., 2010).
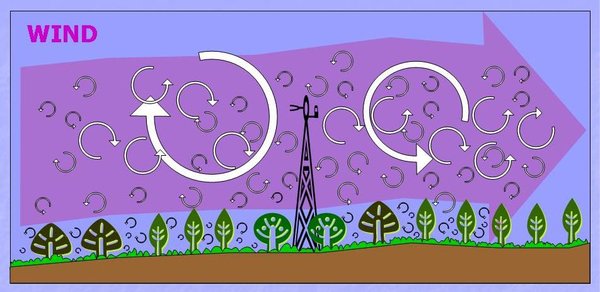
Fig. 5.10 Principle of eddy covariance (or eddy correlation) method – photo by (Burba, G. and Anderson, D., 2010).#
The basic idea behind the method is to count how many molecules/parcels (of the entity) are moving up and down over time, and how fast they travel. This is the definition of a flux: concentration times velocity. So for example for the entity water, at time 1 three molecules of water vapor are moving upwards and at time 2 two molecules are moving downwards. The net flux is then that one water vapor molecule is moving upwards. An eddy covariance system can do this for water to estimate the latent heat flux, for heat to estimate the sensible heat flux, and/or for carbon to estimate the CO\(_2\) flux.
An Eddy Covariance (EC) system (Fig. 5.11) is always equipped with a 3D anemometer to measure the wind speed. Depending on the setup the EC system is also equipped with:
InfraRed gas analyzer to measure
water vapor (for the latent heat flux), and/or
CO\(_{2}\) concentration (for the carbon flux); and
thermocouple to measure the temperature (for the sensible heat flux).
The analyzer and the thermocouple should be installed close or at the height of the anemometer for accurate results. The gas analyzer uses the spectral properties of water vapor and CO\(_{2}\) in the infrared region to measure the concentration. To avoid rainfall accumulating on the IR transmitter, the gas analyzer is often installed on a small inclination. The entire installation is installed on a tower (flux tower). The height of the tower is determined by the so-called flux footprint or fetch (Fig. 5.12). The footprint is the area that the sensors ‘see’ and should contain the area of interest. If the tower is too high the sensors ‘see’ outside the area of interest, or ‘see’ flows that are unaffected by the surface. On the other hand, if the tower is too low small eddies may not be registered (Burba, G. and Anderson, D., 2010). The footprint can be calculated (Schuepp et al., 1990) and is mainly dependent on the measuring height, the surface roughness and the atmospheric thermal stability.
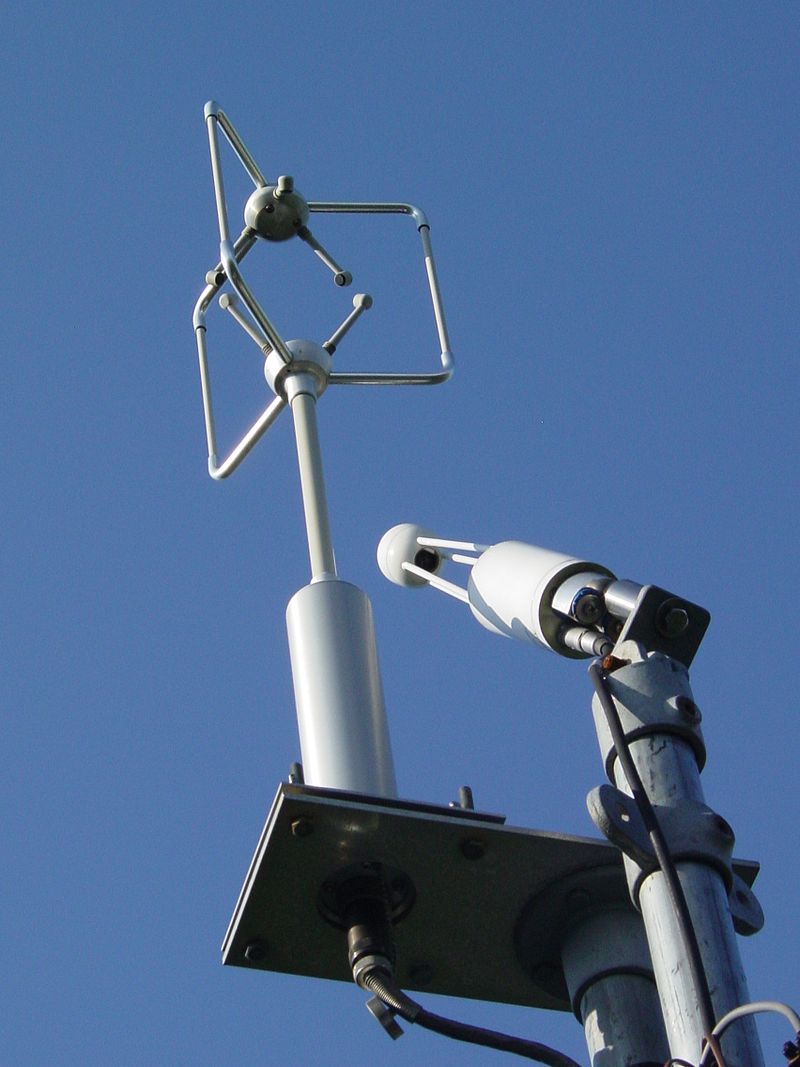
Fig. 5.11 Eddy Covariance instrumentation with sonic anemometer (upper left) and InfraRed gas analyzer (lower right) to measure water vapor and/or CO\(_{2}\) concentrations - photo from (Kevin H. Jones, 2008).#
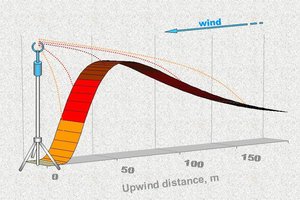
Fig. 5.12 Flux footprint. The darker the red color the more contribution that is coming from the surface area a certain distance away for the instrument – data from (Burba, G. and Anderson, D., 2010).#
Although EC systems are the golden standard to measure the surface energy balance fluxes (e.g., FLUXNET), in practice they are notorious for their large data gaps.
5.2.2.2. Bowen Ratio Energy Balance#
Another way to determine evaporation is by using the energy balance and the Bowen ratio (Bowen, 1926). The Bowen ratio gives the ratio between the sensible heat flux and the latent heat flux. The Bowen ratio can be determined with temperatures and vapor pressures at different heights (\(z\)):
If combined with the energy balance, this can be rewritten into:
To determine the evaporation in this way, it is thus necessary to measure the temperature and actual vapor pressure at least 2 heights, plus the net radiation and ground heat flux. Although this seems rather simple, the method is highly sensitive for measuring errors in the gradients. To overcome this, increasing the number of observations of the height is essential. This could for example be achieved by measuring the temperature and vapor pressure gradients by optic cables (Distributed Temperature Sensing) (Schilperoort et al., 2018).
# Note that the code cells below is used for the website only.
Exercise 5.3 (Bowen ratio)
For two heights you have temperature and humidity data:
Height = 5m : T = 12 degrees, h = 50%
Height = 2m : T = 12.5 degrees, h = 51%
The net radiation equals \(150W/m^2\) and the ground heat flux can be assumed to be 10% of the net radiation.
a) Calculate the bowen ratio.
b) What would be the latent heat, sensible heat, and evaporation?
Answer Exercise 5.3a
First convert relative humidity into ea for the 2 heights:
Thus from (5.19) the bowen ratio is:
Answer Exercise 5.3b
Given the formula:
With G = 0.1 *Rn and solving for H the answer is given by:
And thus for evaporation for the given latent heat:
5.2.2.3. Scintillometer#
A scintillometer makes use of the fact that when water evaporates from a surface, temperature and humidity fluctuations in the near-surface atmospheric boundary layer will occur. These fluctuations cause air density variations, which can be observed when a beam of electromagnetic radiation is emitted from a transmitter to a receiver. By analyzing the intensity variations (or scintillations) in the received signal either the sensible or the latent heat flux can be obtained depending on the used wavelength. When the visible and near-infrared waveband is used the air density differences are mainly caused by temperature fluctuations and hence the scintillometer gives the sensible heat flux. These scintillometers are called Large or Extra-Large Aperture Scintillometers (see Fig. 5.13) and have proven to give accurate line average sensible heat flux estimates up to 10 km and are most often used (McAneney et al., 1995). Combined with net radiation measurements actual evaporation can be determined when the energy balance is used.
Scintillometers can also directly give the latent heat flux. When the micro-to-millimeter waveband is used, the air density differences are most sensitive to moisture fluctuations. Meijninger et al. (2006) showed that these scintillometers can give reasonable evaporation estimates. However, these Small Aperature Scintillometers (SAS) are more expensive compared to Large Aperature Scintillometers (LAS) and are (thus) less commonly used.
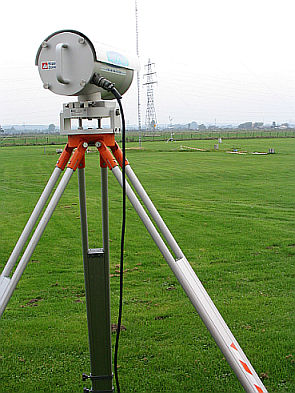
Fig. 5.13 Scintillometer – photo from ( Ringband, 2007).#
