4.2. Measuring precipitation#
Rain gauges, disdrometers, ground-based weather radars and satellites are used for quantitative precipitation estimation (QPE). Accurate precipitation estimates are important for hydrological applications, for example to obtain accurate discharge forecasts. For this purpose the spatial and temporal variability of rainfall should be captured as accurately as possible. For more information on precipitation (measurement), see the KNMI website (research, publications), Buishand and Velds (1980) (in Dutch) and Overeem et al. (2024).
4.2.1. Rain gauges#
A rain gauge is a device that collects rain in a funnel and then measures the amount of water. Rain gauges can be divided into three main classes: manual gauges, mechanical chart-recording gauges, and electrical gauges. The rainfall amount of a manual rain gauge is typically determined by emptying the gauge into a graduated cylinder on a daily basis. The area of the funnel of the 150,000 manually read (but not necessarily reporting to global databases) gauges worldwide ranges from 127 to 400 cm\(^2\). Mechanical chart-recording gauges supply information on the time when rain starts and stops and give an approximate indication of the rate of rainfall. A pen is moved across a paper chart to measure the rate of rainfall during the day. Electronic rain gauges also provide a near-continuous rainfall measurement. The type most widely used is the tipping-bucket gauge, where the number of bucket tips is recorded, from which the rainfall intensity can be derived. Another type is the electronic weighing rain gauge (Strangeways, 2007).
The set-up of a rain gauge is important. It should not be located too close to buildings or other high obstacles. Particularly in urban areas it is difficult to find a suitable location for measuring rainfall. Rain gauges installed above ground suffer from undercatch due to wind and turbulence. Automatic rain gauges require good maintenance and inspection to obtain accurate point rainfall depths.
In the Netherlands, KNMI maintains two independent rain gauge networks: an automatic network of approximately 32 gauges (\(\approx 1\) station per 1000 km\(^2\)) and a manual network of approximately 319 gauges (\(\approx\) 1 station per 100 km\(^2\)). The electronic rain gauge measures the precipitation depth using the displacement of a float placed in a reservoir. The 24-h precipitation depth from the manual gauges is measured at 08:00 UTC. Fig. 4.8 (top left) shows the automatic rain gauge which is used at KNMI’s automatic weather stations in the Netherlands. Gauges are surrounded by a wall with a height of 0.40 m or wind screen to avoid undercatch due to wind and turbulence.
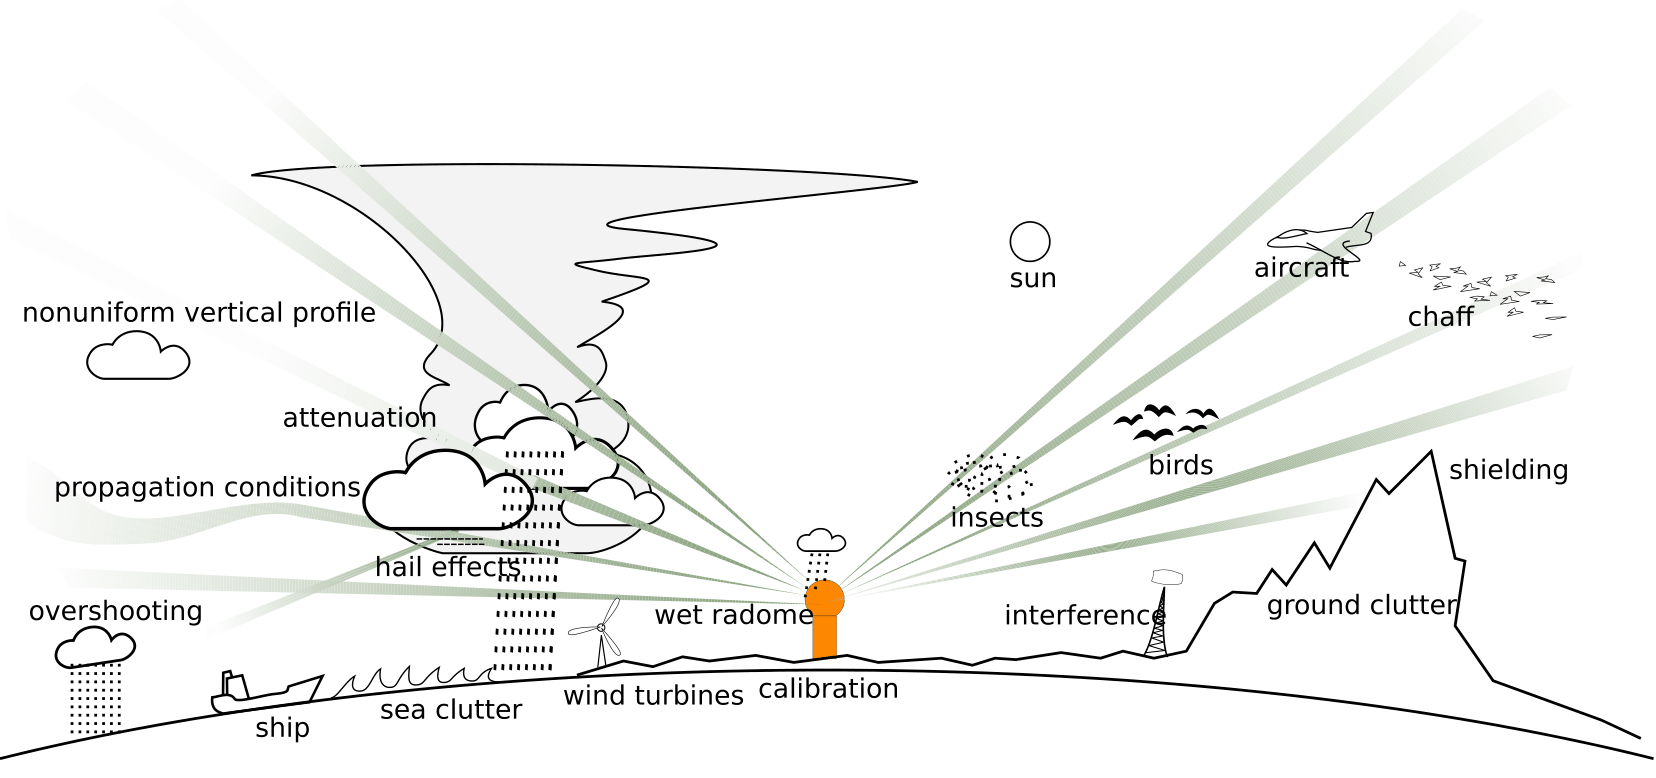
Fig. 4.8 Possible errors which may hamper quantitative precipitation estimation using weather radar. Reproduced with permission of Markus Peura (Finnish Meteorological Institute) – photo from (Journée, 2023).#
4.2.2. Disdrometers#
Drop size distributions (DSDs) are commonly measured by disdrometers (“dis” for distribution; “dro” for drops), which record the sizes (and sometimes fall velocities and drop shapes) of raindrops falling on or through a horizontal plane in a given time interval. This may be done by e.g. measuring stains on filter paper, measuring the impact of drops on a surface, measuring the magnitude and duration of the extinction of light caused by a raindrop, measuring the position of the extinction of light with an array of detectors, or using the Doppler shift in an electromagnetic signal caused by falling raindrops. There may be large differences between DSDs measured by all of these disdrometers, which are caused by differences in measurement principles and/or different sampling areas or volumes. Another issue that is usually associated with disdrometers is sampling uncertainty. Because of the (usually) limited sampling area or volume, obtaining statistically robust measurements of DSDs is a challenge. Despite these limitations, measurements made by disdrometers are still valuable.
The 2-D video disdrometer (2DVD, Fig. 4.9, middle) estimates drop sizes, fall velocities and shapes through measurement of the extinction of light. Two sheets of light, located at a slight vertical distance, are emitted horizontally and then both sampled with two line-configurations of sensors. The shapes (and hence sizes) of the particles falling through the 100 cm\(^{2}\) planes constructed in this way can then be determined by the number of sensors that register a decrease in signal. The vertical velocity of the drop can be determined by the delay in signal between the two lines of sensors. The optical disdrometer (Fig. 4.9, right) uses a single rectangular light beam to estimate raindrop sizes and fall velocities. The magnitude and duration of the optical extinction caused by a drop are measures for its size and velocity, respectively.
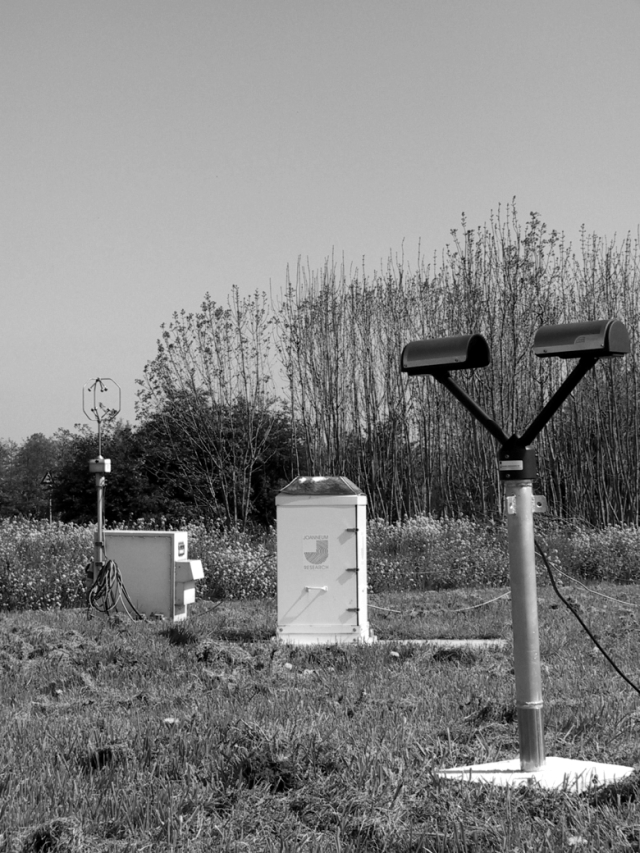
Fig. 4.9 A 2-D video disdrometer (middle, with processing unit and sonic anemometer, left) and an optical disdrometer (right) at Cabauw, The Netherlands (Metselaar et al., 2022).#
4.2.3. Weather radars#
Fig. 4.10 The radar tower in De Bilt, The Netherlands (top right). The radome protects the antenna of the radar system. The best of two worlds (top left): combine the rain gauge (in front) and the weather radar (background). The lower plots show the circular parabolic reflector with antenna feed, together named antenna, of the former KNMI weather radar in De Bilt (inside the white radome on the tower) (Metselaar et al., 2022).#
Weather radars are a type of ground-based remote sensing instrument and have become an important tool for real-time quantitative precipitation estimation over large areas. They are, for instance, used in water management and nowcasting (i.e. short-term forecasting) of precipitation. Current operational weather radar products have a spatial resolution of typically 1 km in the horizontal and a temporal resolution of 5 min. Fig. 4.10 (left) shows the KNMI radar tower in De Bilt, the Netherlands. KNMI radar rainfall products are extensively used by the hydrological community, especially water authorities, and there is even a tendency to start using these products for urban water management. This is the result of the improved quality of radar rainfall products and new commercial hydrological software.
The number of radars has grown steadily over the years, resulting in an almost complete coverage of, among others, the United States and Europe (Fig. 4.14). Nowadays, the general public can freely access real-time radar images of rainfall intensities on the internet, the most well-known radarproduct.
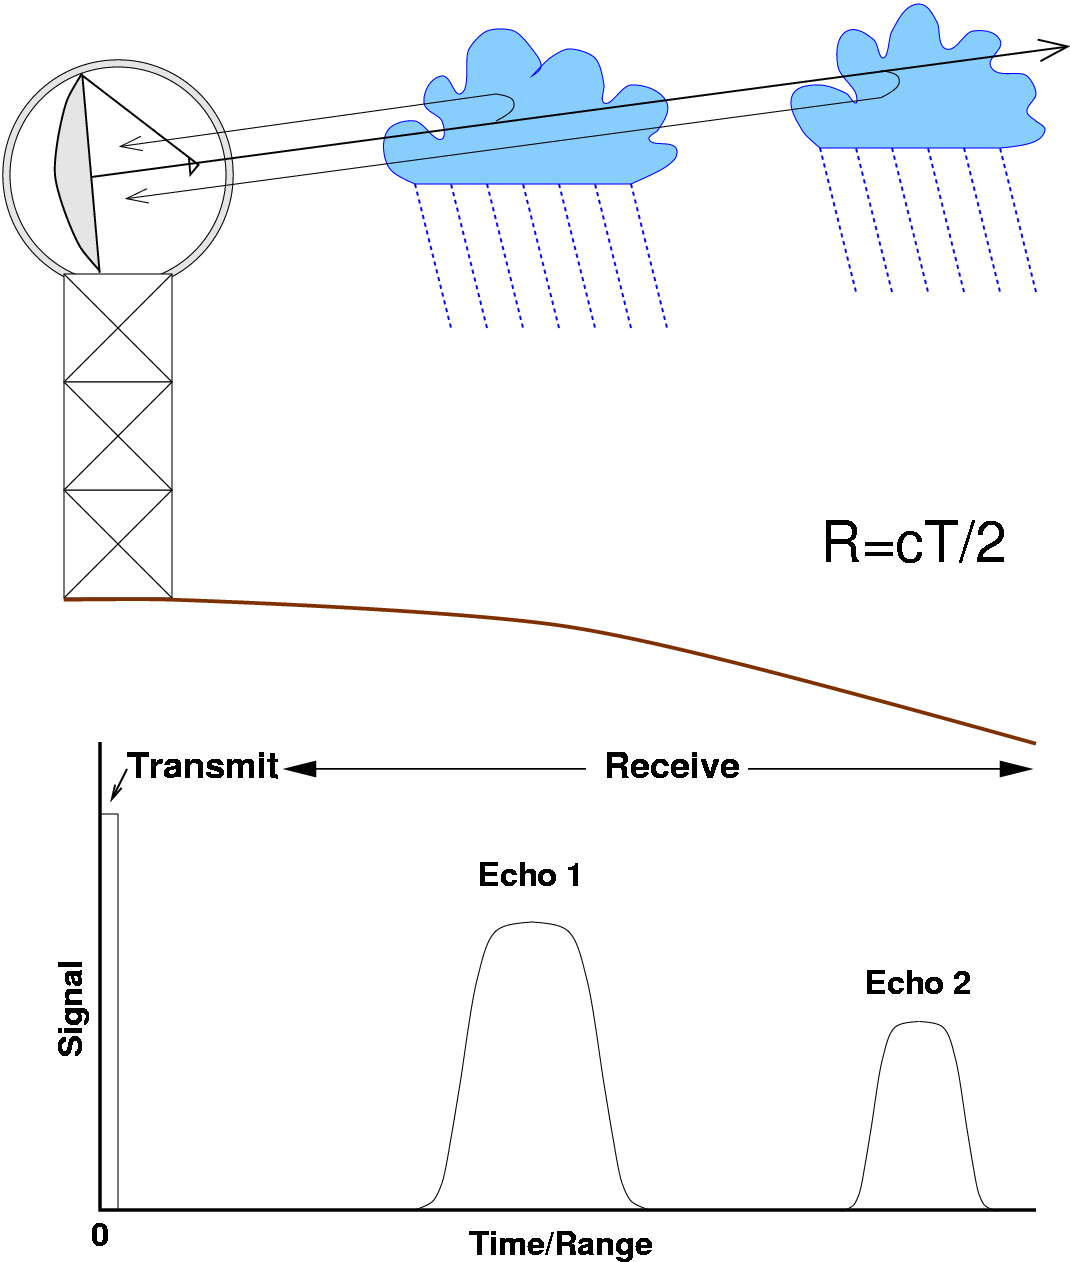
Fig. 4.11 Principle of rainfall measurement using weather radar, where \(R\) indicates the range, \(c\) the speed of light, \(T\) the time delay and the division by 2 accounts for the two-way distance (courtesy of Dr. Iwan Holleman).#
The weather radar antenna (Fig. 4.10) transmits electromagnetic radiation as pulses into the atmosphere. The pulses can have different wavelengths: about 3 cm (called X-band), 5 cm (C-band) or 10 cm (S-band). Part of the transmitted radiation is backscattered by hydrometeors, such as raindrops, snow flakes and ice crystals. A radar beam with a shorter wavelength can more easily detect smaller droplets (drizzle for example). The receiver of the radar system is capable of measuring the power of the backscattered echoes. The range (distance) of the target with respect to the radar can be calculated from the time delay between transmission and reception of a pulse, which travels with the speed of light (Fig. 4.11). Along its way from the radar antenna to a particular volume in the atmosphere and back, the signal amplitude decreases, among other things due to attenuation by rainfall. This is caused by absorption and scattering of the electromagnetic waves by raindrops. An S-band radar beam (with a larger wave length) can travel a longer distance before its signal is completely lost than an X-band radar beam. The radar typically transmits 450 pulses per second while turning 12\(^\circ\) per second. With the radar equation, the radar reflectivity factor \(Z\) [mm\(^6\)/m\(^{3}\)] is computed:
With:
\(Z\) |
Radar reflectivity factor |
[L\(^{6}\)/L\(^{3}\)] |
[mm\(^{6}\)/mm\(^{3}\)] |
\(P_r\) |
Received power |
[ML\(^{2}\)/T\(^{3}\)] |
[W] |
\(r\) |
Distance to the radar |
[L] |
[m] |
\(C\) |
Radar constant |
[T\(^{3}\)/ML] |
where \(P_r\) is the received power [W] and \(r\) is the distance to the radar [m]. The radar constant \(C\) depends solely on radar characteristics: the wavelength of the transmitted radiation, the dimensions of the sampling volume, the transmitted power and some constants. In case of liquid precipitation (rainfall), the radar reflectivity factor \(Z\) depends mainly on the size distribution of the raindrops in the radar sampling volume. Subsequently, the \(Z-R\) relationship is employed to calculate the rainfall intensity \(R\) [mm/h] from the radar reflectivity factor \(Z\):
With:
\(Z\) |
Radar reflectivity factor |
[L\(^{6}\)/L\(^{3}\)] |
[mm\(^{6}\)/mm\(^{3}\)] |
\(R\) |
Rainfall intensity |
[L/T] |
[mm/h] |
\(a\) |
Z-R coefficient |
dependent on value b |
|
\(b\) |
Z-R coefficient |
[-] |
where the coefficients \(a\) and \(b\) depend on rainfall type (drop sizes and shapes). The coefficient \(b\) is dimensionless and the units of \(a\) depend on the value of \(b\). Often a fixed \(Z-R\) relationship is used with \(a = 200\) and \(b = 1.6\), which is particularly suitable for stratiform precipitation. The optimal values of \(a\) and \(b\) may change considerably for other types of rainfall. For instance, values of \(a = 250\) and \(b = 1.2\) are used for tropical convective systems. A typical operational weather radar (C-band or S-band) gives an almost real-time overview of the rainfall intensities over large areas, up to a range of a few hundred kilometers from the radar.
Quantitative precipitation estimation from weather radar can be hampered by a number of errors (see Fig. 4.8 for an overview). Radar measures precipitation indirectly, using several assumptions, and at larger altitudes above the Earth’s surface (where snow and ice may be present), whereas for most applications rainfall at the Earth’s surface is of interest. The most important errors for operational weather radars at midlatitudes are attenuation of the radar beam as a result of strong precipitation or a wet radome (the protecting sphere around the radar itself), errors caused by a nonuniform vertical profile of reflectivity or variability of the drop size distribution.
Especially at long ranges from the radar, rainfall intensity can be underestimated, for instance because of overshooting of precipitation. Overshooting is caused by the increasing height of observation, which is owing to the Earth’s curvature and the beam elevation angle. In this case precipitation is underestimated if the radar reflectivity decreases with height. This typically occurs in winter, when stratiform rainfall from low clouds is dominant. Fig. 4.12 displays the height of four elevations which are important to construct radar rainfall products in the Netherlands. The gray-shaded areas indicate the 1\(^\circ\)-beam, the part which contains most of the power of the pulse, for the lowest and highest elevation. The center of the radar beam is at 2 km height at the borders of the Netherlands (\(\approx\) 150 km) and frequently results in (partial) overshooting of precipitation in winter. The resulting underestimation can be seen in Fig. 4.13 (left), which represents the monthly rainfall depth for a typical winter month in the Netherlands. The underestimation is quite severe compared to the map of interpolated rain gauge data (middle).
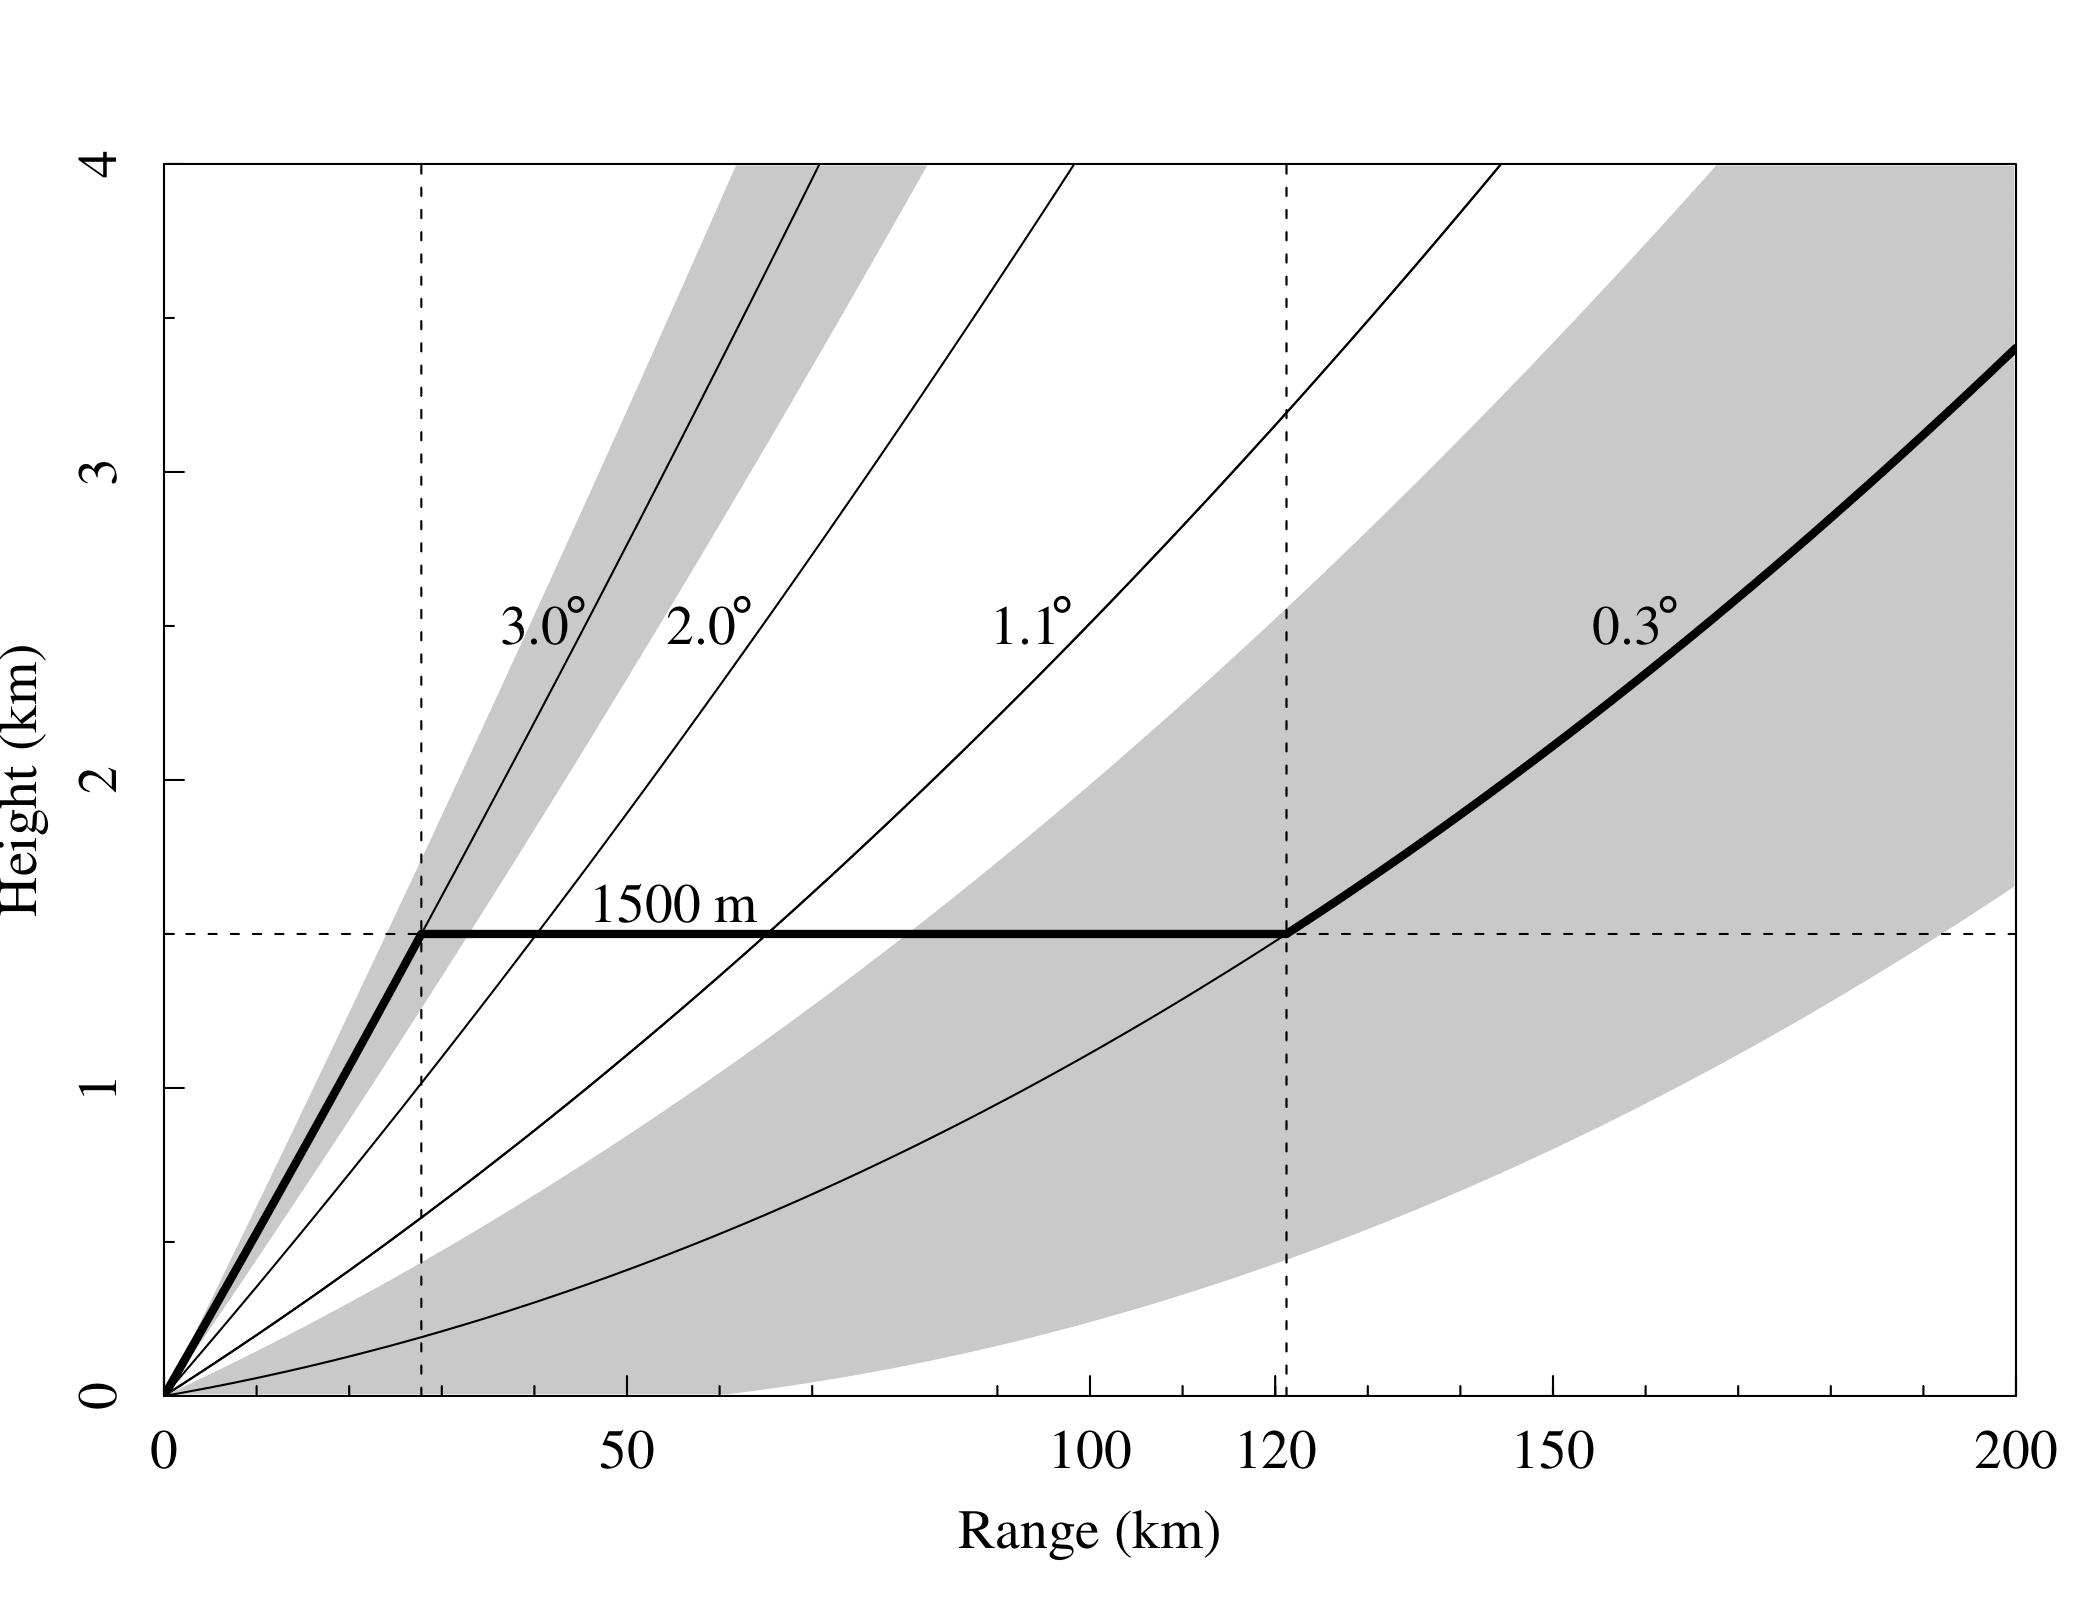
Fig. 4.12 The height of four beam elevations which are important for constructing radar rainfall products in the Netherlands (Metselaar et al., 2022).#
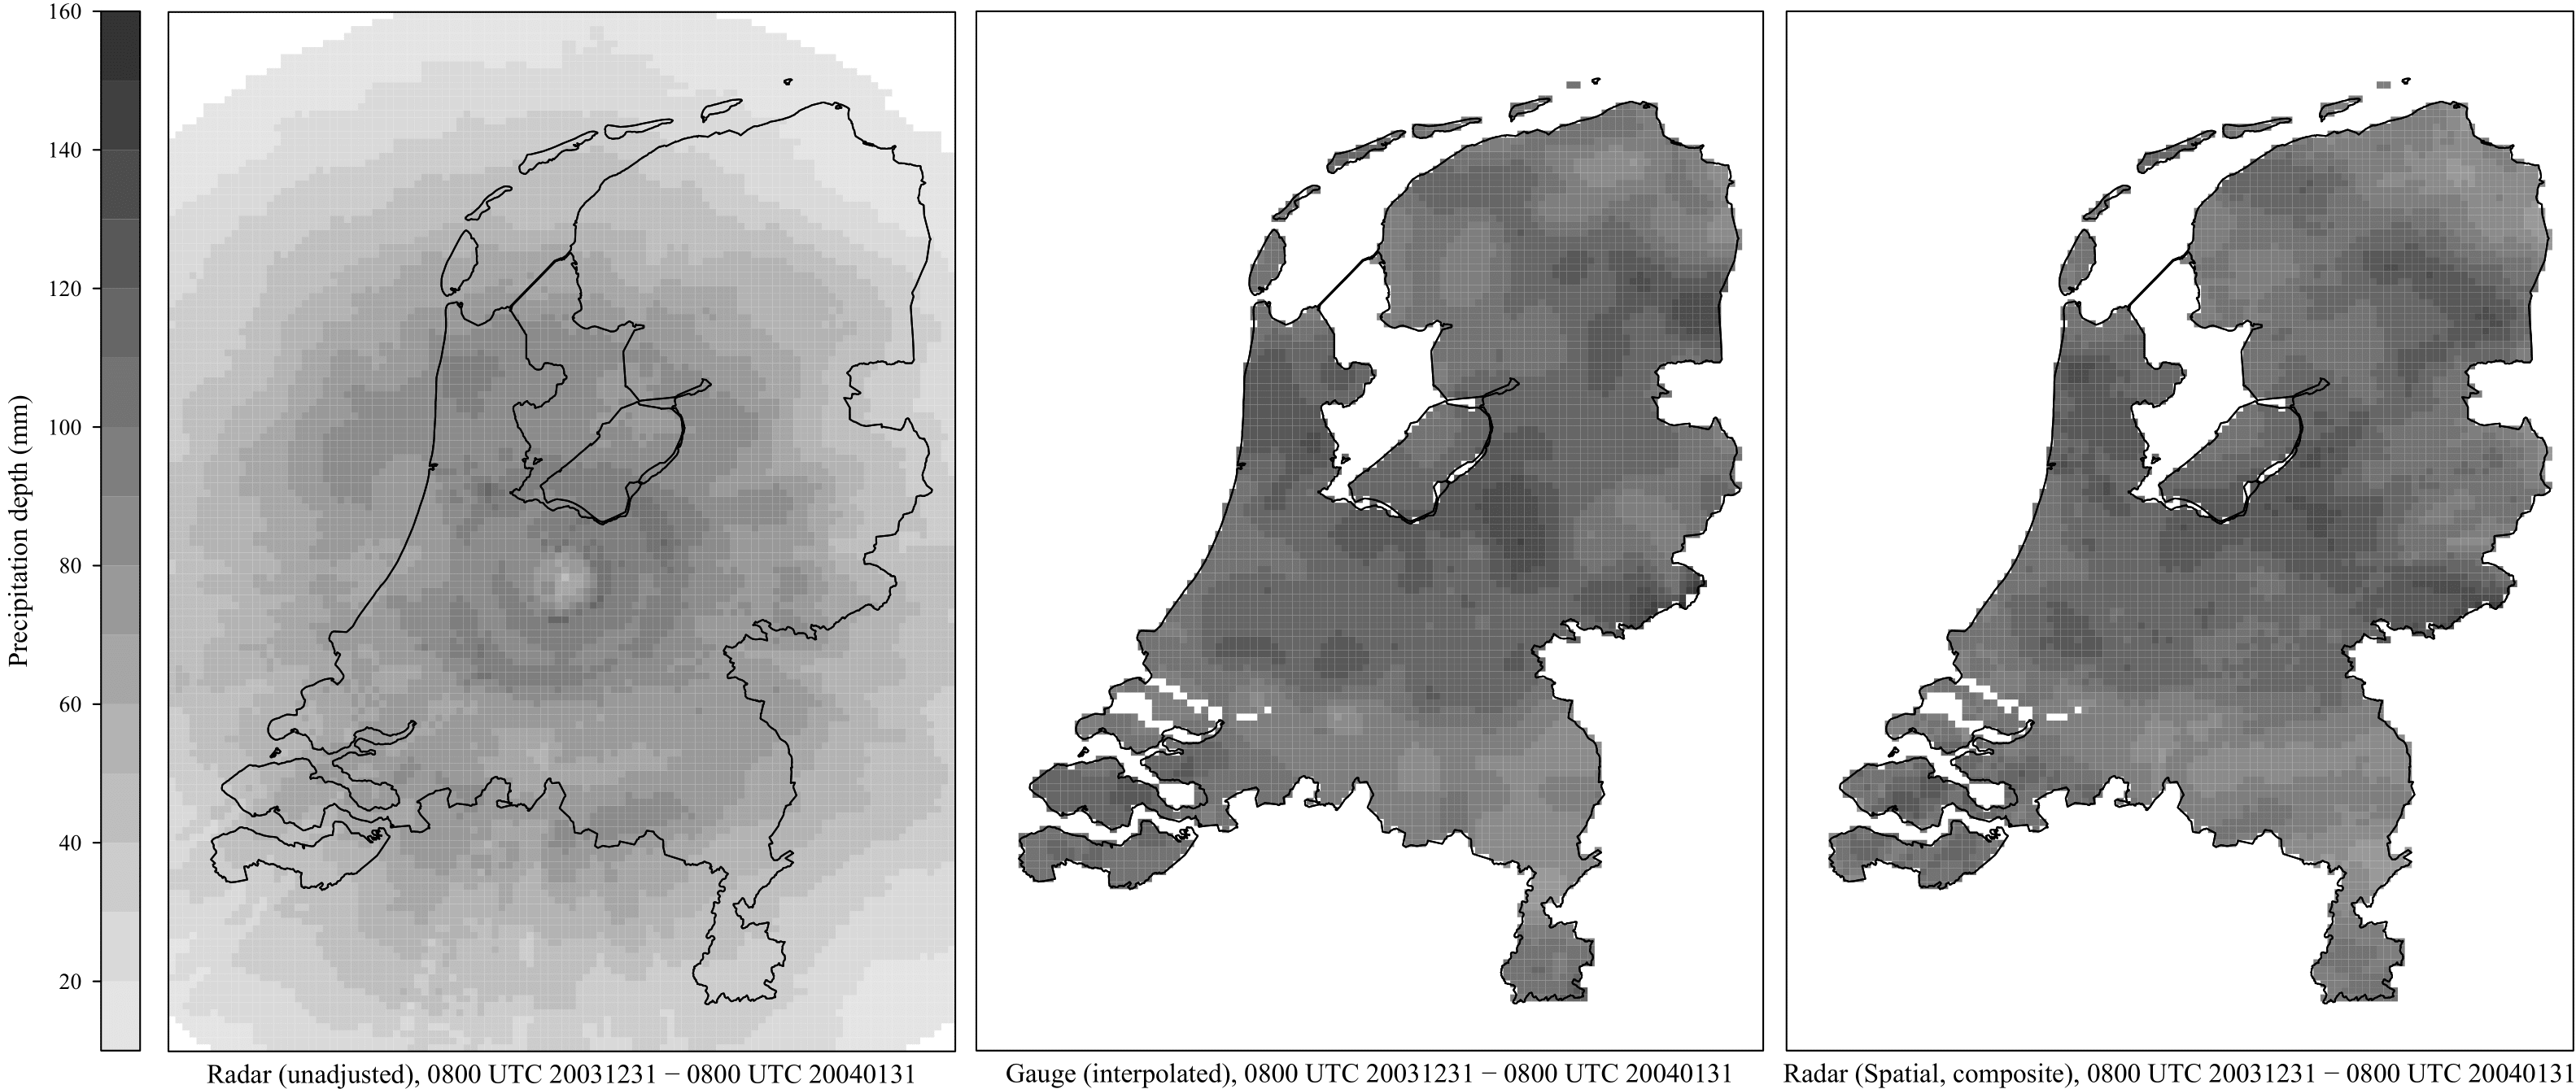
Fig. 4.13 Monthly rainfall depth for January 2004 for unadjusted radar data (left), interpolated rain gauge data (middle), and spatially adjusted radar data (right) (Metselaar et al., 2022).#
Because of these possible (sources of) errors, it is necessary to adjust radar rainfall depths before these can be used in hydrological applications. This is commonly done with rain gauge data. Rain gauges are assumed to provide accurate point measurements of rainfall (if well maintained), while weather radars give semi-quantitative precipitation estimates. On the other hand, radars are better capable of revealing the spatial structure of rainfall in detail than rain gauge networks. The best of two worlds is to combine weather radar with rain gauge data. Data from gauges and from radar adjusted with gauges will never be completely the same, partly because of representativeness errors, since the radar measures in a large volume with a 1-km horizontal resolution, at a significant height (1 km or more) above the ground, whereas the rain gauge essentially provides a point measurement (with a typical orifice area of 100 to 400 cm\(^2\)) at ground level.
Note
Another class of radars, mostly used for atmospheric research, is of the frequency-modulated continuous-wave (FM-CW) type. However, as most operational weather radars worldwide are of the pulsed type, we do not discuss FM-CW radars further here.
4.2.4. Satellites#
Quantitative precipitation estimation from satellites is generally considered to be less accurate than from rain gauges or weather radars. However, satellite precipitation estimates are particularly valuable over oceans and remote areas, where few ground-based (remote sensing) measurements are available. Satellite constellations provide global estimates of precipitation on a near real-time basis. Satellite precipitation estimates are obtained from remotely sensing the radiation emitted or reflected by atmospheric hydrometeors. This can be done by several techniques that depend on the type of sensor and the range of the electromagnetic spectrum used (Bogerd et al., 2021, Kidd et al., 2010, Rios Gaona et al., 2017):
Visible (VIS) and infrared (IR) methods – in which measurements of reflectance and cloud-top temperature, or retrieved cloud properties such as water path, particle effective radius, and height are related to occurrence and intensity of precipitation;
Passive microwave methods – in which liquid or solid precipitation is identified through measurements of microwave radiation (expressed in terms of brightness temperature) from both hydrometeors and the Earth, which may be scattered and/or absorbed by hydrometeors;
Active microwave methods – in which rainfall information is retrieved from power measurements of the backscatter produced by the interaction of hydrometeors and electromagnetic pulses emitted by satellite-borne radars;
Multisensor techniques – in which the combination of data collected within a satellite constellation overcomes some of the deficiencies of the above-mentioned techniques, for instance, temporal sampling, spatial resolution, and indirect measurements.
From the perspective of precipitation estimation, meteorological satellites can be divided into two categories: geostationary earth orbit (GEO) and low earth orbit (LEO or polar). GEO satellites (carrying visible and infrared sensors) orbit the Earth at ~36,000 km and maintain a fixed position to match Earth’s rotation; thus, always the same area is scanned. LEO satellites (carrying radiometers or radars) orbit the Earth mostly in polar (sun-synchronous) orbits at 400 to 800 km above the Earth’s surface.
Quantitative precipitation estimation from satellites is mostly performed using microwave sensors on board of LEO satellites. The Tropical Rainfall Measuring Mission (TRMM) was a successful example, covering the globe from 35\(^{\circ}\)S to 35\(^{\circ}\)N with a revisit time up to several days (Fig. 4.2). The TRMM mission was in operation from 1997 to 2015. Since 2014, the Global Precipitation Measurement (GPM) mission satellite constellation is in operation. GPM provides precipitation estimates from 60\(^{\circ}\)S to 60\(^{\circ}\)N at a spatial resolution of \(0.1^{\circ} \times 0.1^{\circ}\) every 30 minutes, with a minimum latency of 4 h, i.e., in near-real time.
As an example of precipitation estimation from GEO satellites, consider the SEVIRI (visible and infrared) instrument on board of the Meteosat Second Generation (MSG) satellites. SEVIRI scans the complete disk of the Earth every 15 minutes. The short revisit time is an advantage over the TRMM and GPM satellites. However, the MSG does not carry an (active) precipitation radar, leading in general to less accurate precipitation estimates. Nevertheless, Roebeling and Holleman (2009) show that rainfall intensities retrieved from MSG during daytime agree reasonably well with those based on unadjusted weather radar data for an area in the Netherlands. This holds a promise for using the MSG satellites for quantitative precipitation estimation during daytime over areas for which no other precipitation observations are available.
Strangeways (2007) expects that the future of precipitation measurement mainly consists of combining rain gauge data with satellite data. This will certainly be the case for global precipitation estimation, since globally radars are more sparse than rain gauges. However, over large parts of the oceans there are no rain gauges available for corrections, leaving satellites as the only source of precipitation estimates. At the same time, ground-based weather radars are becoming the main source of quantitative precipitation estimates in developed countries, which contain many of the world’s most densely populated areas. For the time being, a multi-sensor approach using weather radar and rain gauges is to be recommended for these regions. For those continental areas lacking weather radar coverage, notably low- and middle-income countries in the global south, opportunistic sensing (see section on commercial microwave links) holds a promise for complementing satellite-based rainfall products.
4.2.5. Ongoing developments#
Although radar rainfall products are useful for hydrological applications, more research is needed to further improve their quality. This particularly holds for real-time radar rainfall products of sub-daily accumulations, because often only few rain gauge data are available for adjustment in real time.
4.2.5.1. Physical corrections of radar data#
Volumetric (3-D) radar data (Fig. 4.5) can be used to obtain better precipitation estimates at ground level. For instance, the vertical distribution of radar reflectivity factors can be taken into account to obtain more accurate precipitation estimates at longer ranges from the radar. Physical corrections can also be applied to remove non-meteorological echoes, also called clutter, and rain-induced attenuation, or to correct for advection (Overeem et al., 2021, Overeem et al., 2020). Hazenberg et al. (2011) apply several physical corrections to radar data and show that these data can be used to calculate accurate discharges for the Ourthe, a tributary of the Meuse river.
4.2.5.2. European radar composite#
A European radar rainfall composite has been developed in the framework of the OPERA project, using the weather radars shown in Fig. 4.14. This composite forms the basis for a high-quality gauge-adjusted climatological radar rainfall dataset for Europe (Overeem et al., 2023). National radar rainfall products are usually based on data from combinations of national radars and rain gauges only. By employing data from radars and rain gauges in neighboring countries as well, the quality of rainfall composites will increase. This is because the distance to the radar will decrease for many areas, which limits, for instance, the errors due to overshooting of precipitation or due to attenuation.
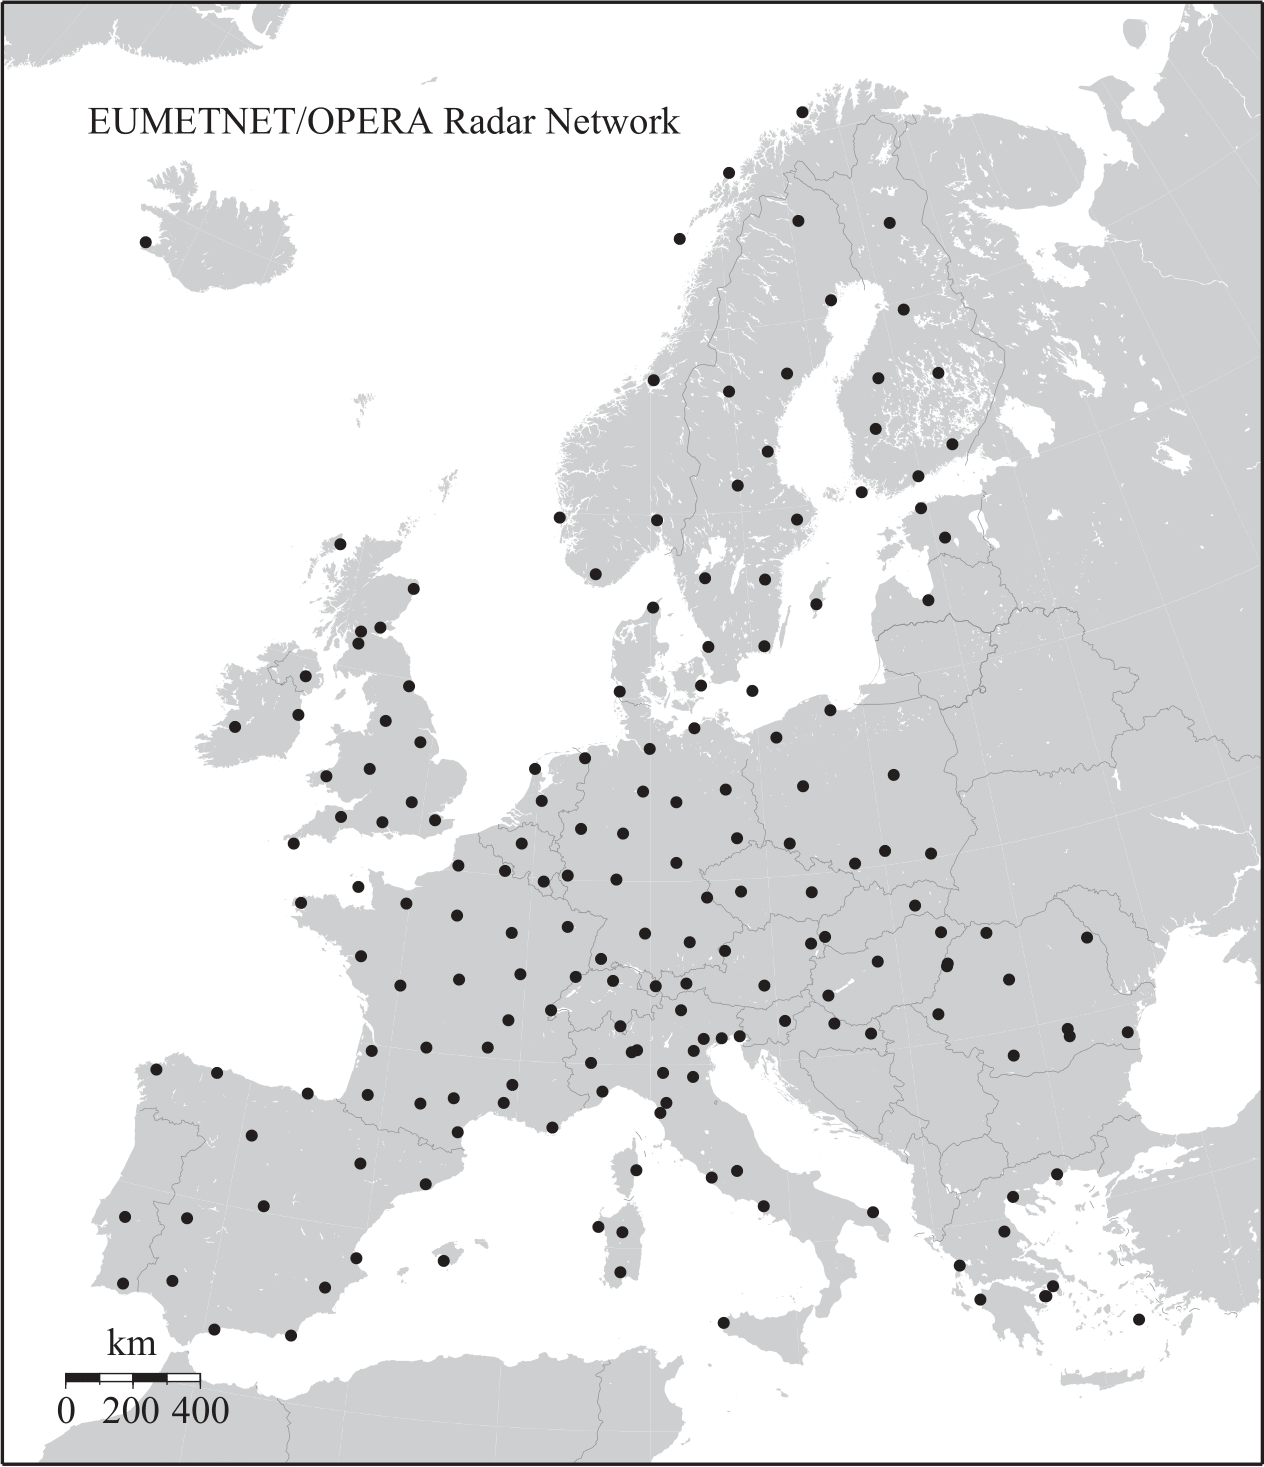
Fig. 4.14 Map of Europe showing the locations of 180+ operational weather radars (Metselaar et al., 2022).#
4.2.5.3. New types of weather radars#
An important development is the installation of radars with dual-polarization capability in several countries, such as France, Germany, the United Kingdom, the United States and the Netherlands. This type of radar allows better correction for attenuation and determination of the precipitation type. This leads to a better discrimination between rain, hail, ground clutter and other spurious echoes, resulting in a better retrieval of rainfall intensities from radar reflectivities.
Note
This type of radar is able to transmit and receive signals at orthogonal polarizations, from which additional information (e.g. via measurements of differential reflectivity and specific differential phase shift) concerning the shape and hence the size of hydrometeors can be obtained.
Dual-polarization radars of the X-band type are specifically suited for urban areas, because of their high spatial resolution, with radar pixels smaller than 1 km\(^2\), and their high temporal resolution, typically one scan per minute. This increases the quality of 5-min rainfall depths compared to those obtained from C-band radars, which usually only scan once every 5 minutes. On average over their measurement domain (sometimes referred to as radar umbrella), X-band radars measure at lower heights above the Earth’s surface, thus their measurements are more representative for rainfall at the ground. Drawbacks are their limited range of typically 50 km and their sensitivity to rain-induced attenuation. An X-band network would be interesting for mountainous areas to overcome shielding errors, and can be helpful for issuing flash flood warnings and for urban water management.
Recent research has shown, however, that the technological improvements of weather radar systems and new adjustment procedures using volumetric radar data are not sufficient to completely overcome the need for adjustment methods using rain gauges.
# Note that the code cells below is used for the website only.
Exercise 4.2
Rainfall can be measured by means of (weather) radar.
a) Explain the principle of precipitation measurements by means of weather radar.
b) Weather radar and traditional rain gauges are often referred to as complementary methods. What does this mean?
Answer Exercise 4.2a
RADAR stands for RAdio Detection And Ranging, i.e. the detection of distant objects (in this case a rainstorm) by transmission of radiowaves and the reception of the reflected signal. From the time between the transmission and reception of the signal the distance to the storm can be calculated; from the difference between the transmitted and received power the rainfall intensity can be inferred (in the sense that the larger the reflected signal, the smaller the difference).
Answer Exercise 4.2b
Radar: point measurement in time, integrated measurement in space; Raingauge: point measurement in space, integrated measurement in time.
Radar: indirect measurement (remote sensing) in the atmosphere; Raingauge: direct measurement (in situ) at the land surface.
Radar: Full spatial coverage; but reduced local accuracy; Raingauge: point measurement but higher accuracy locally.
4.2.5.4. Commercial microwave links#
The estimation of rainfall using commercial microwave links (CMLs) from cellular communication networks is a new and potentially valuable additional source of information. These links consist of two antennas which send and receive mobile telephone messages and conversations as electromagnetic signals. Due to scattering and absorption, rainfall attenuates the electromagnetic signals transmitted from one antenna to another (Fig. 4.15). This is useless noise for the telecommunication company, but can be used to estimate rainfall intensities. By measuring the received power at one end of a microwave link as a function of time, the attenuation due to rainfall can be calculated. These received powers are a by-product of the communication between mobile telephones and are in general only used to monitor the stability of the link connection.
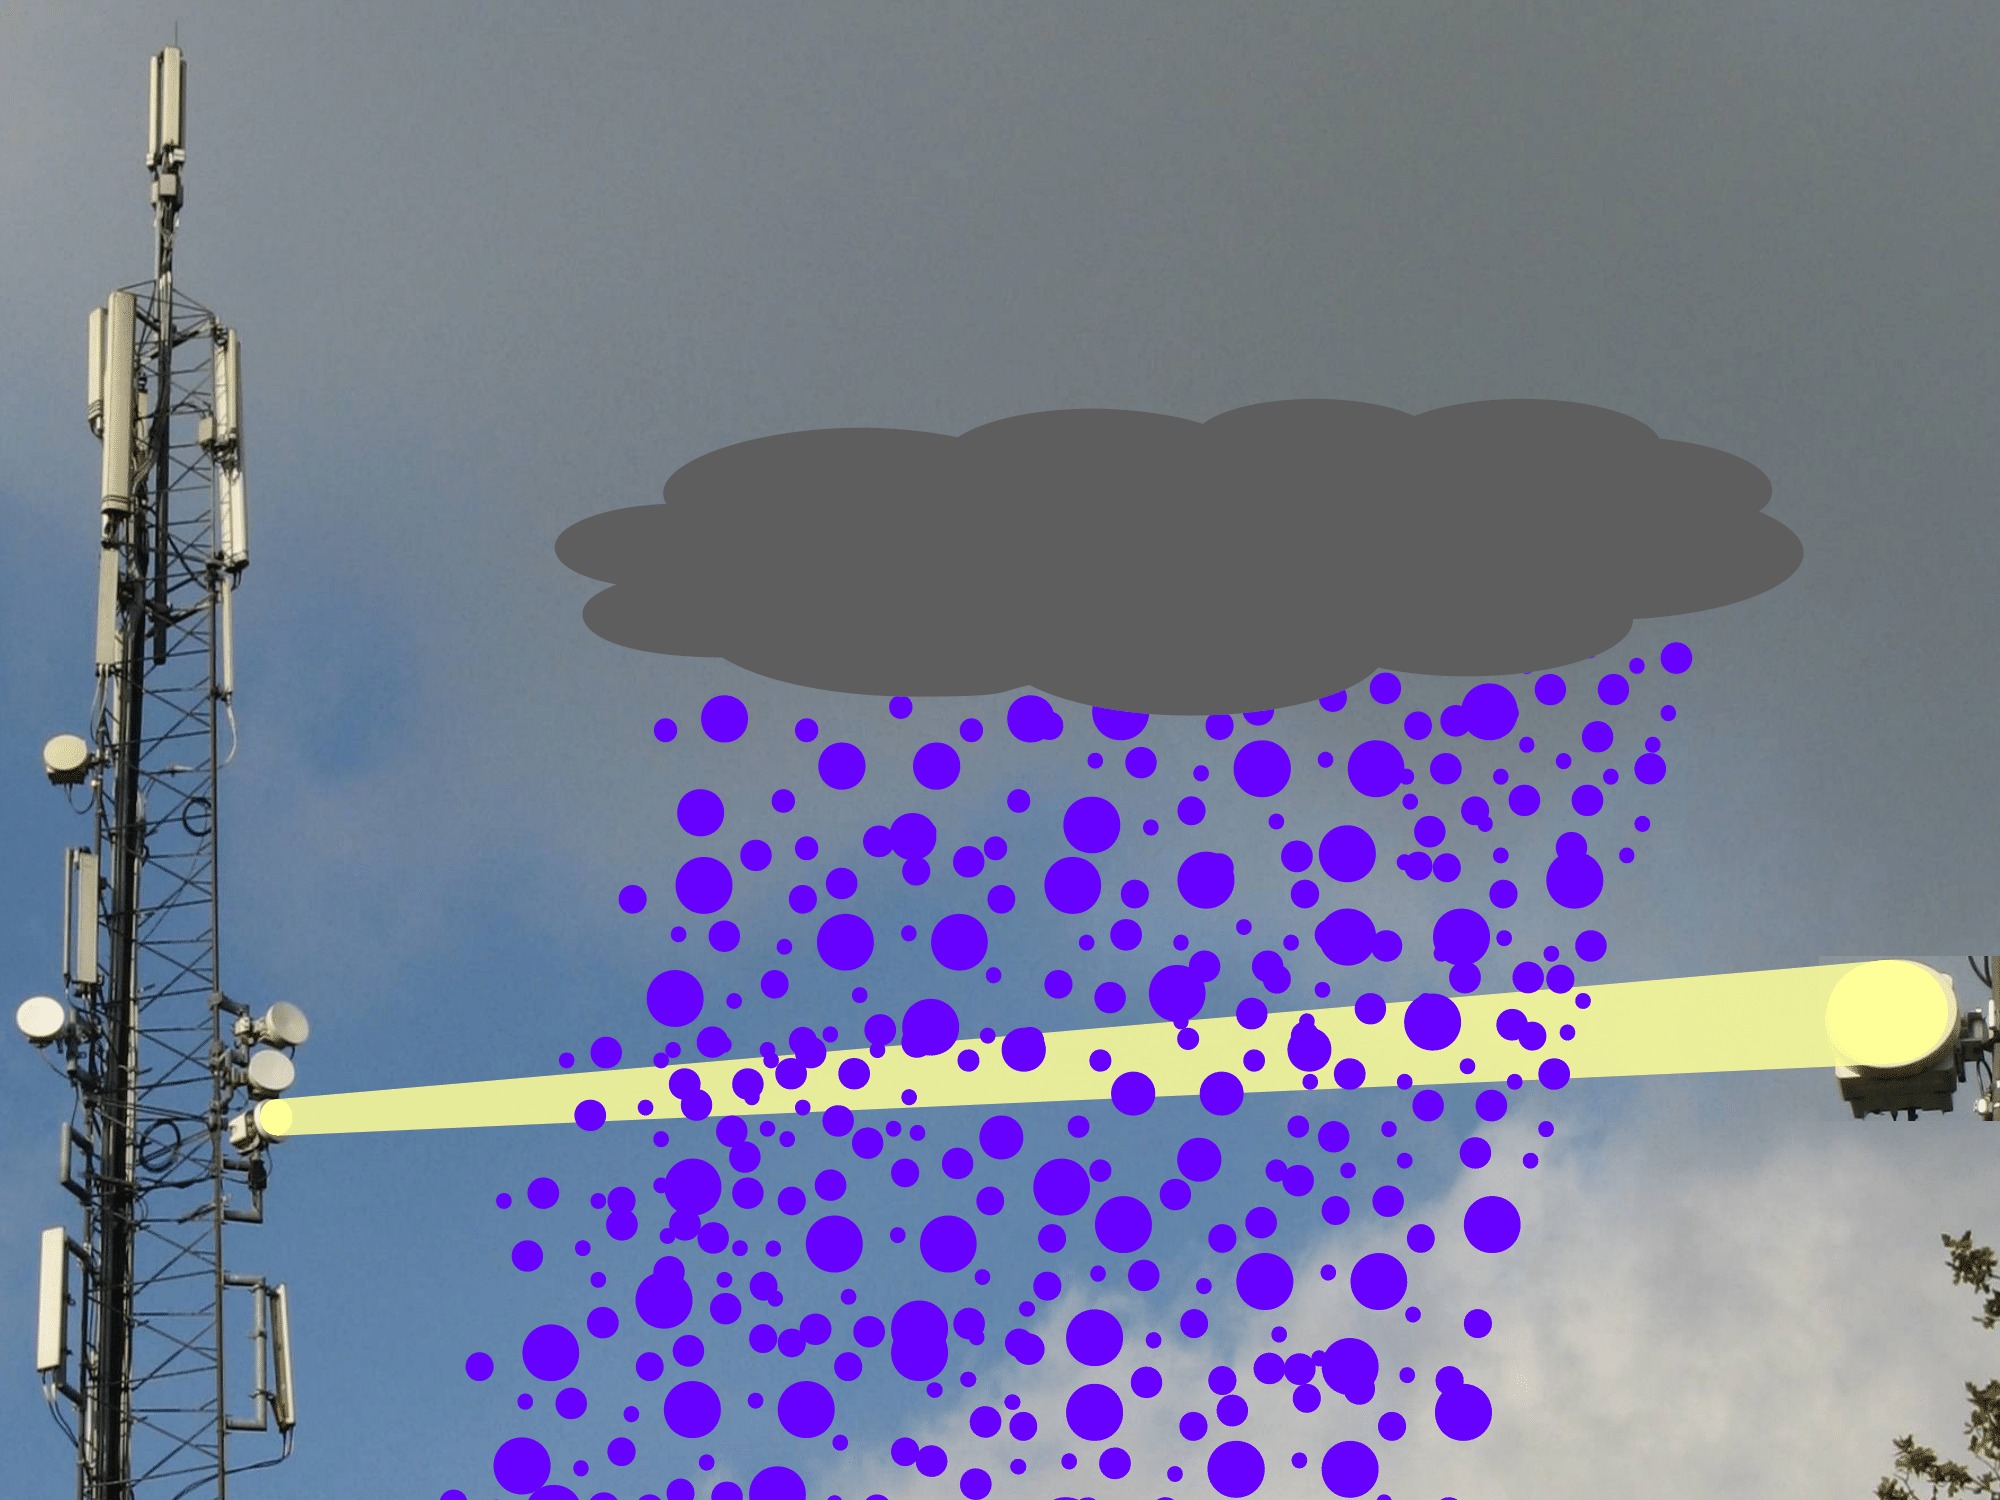
Fig. 4.15 Signals transmitted from the antenna of a telephone tower to the antenna of another telephone tower are attenuated due to rainfall (Metselaar et al., 2022).#
The data often consist of minimum and maximum received powers over 15-min intervals. The mean path-average rainfall intensity \(R\) is computed from the minimum and maximum received power with (Overeem et al., 2011):
With:
\(P\) |
Received power |
[ML\(^{2}\)/T\(^{3}\)] |
[dBm] |
\(P_{min}\) |
Minimum received power |
[ML\(^{2}\)/T\(^{3}\)] |
[dBm] |
\(P_{max}\) |
Maximum received power |
[ML\(^{2}\)/T\(^{3}\)] |
[dBm] |
\(A_a\) |
Correction for wet antennas |
[dB] |
|
\(\alpha\) |
Factor to distribute the relative contributions of the minimum and maximum received power |
[-] |
|
\(L\) |
Link lenght |
[L] |
[km] |
\(c\) |
Coefficient |
dependent on the value of \(d\) |
|
\(d\) |
Coefficient |
[-] |
where \(P\) is the received power [dBm, i.e. ten times the logarithm to base 10 of the received power expressed in mW], \(P_\mathrm{min}\) is the minimum received power over the 15-min time interval, \(P_\mathrm{max}\) is the maximum received power over the 15-min time interval, \(P_\mathrm{ref}\) is the reference signal level, which is the signal power in the absence of rain. The coefficient \(A_\mathrm{a}\) is a correction for wet antennas (expressed in dB, i.e. decibels, ten times the logarithm to base 10 of the fraction of wet antenna attenuation, which can be used directly in the equation), \(\alpha\) is used to distribute the contribution of the minimum and maximum received power, \(L\) is the link length in km and \(c\) and \(d\) are coefficients. Coefficient \(d\) is dimensionless and the unit of \(c\) depends on the value of \(d\).
Messer et al. (2006) and Leijnse (2007) have shown that average rainfall intensities over the length of a commercial single-frequency microwave link can be derived from the measured attenuation. Fig. 4.16 shows for one link that for a wet day the minimum received powers are strongly negatively correlated with the mean path-averaged radar rainfall intensity, as would be expected. This makes commercial microwave link networks potentially promising for measuring rainfall with a high temporal resolution, which is particularly important in urban areas. Microwave link information could also be used to adjust instantaneous radar rainfall depths.
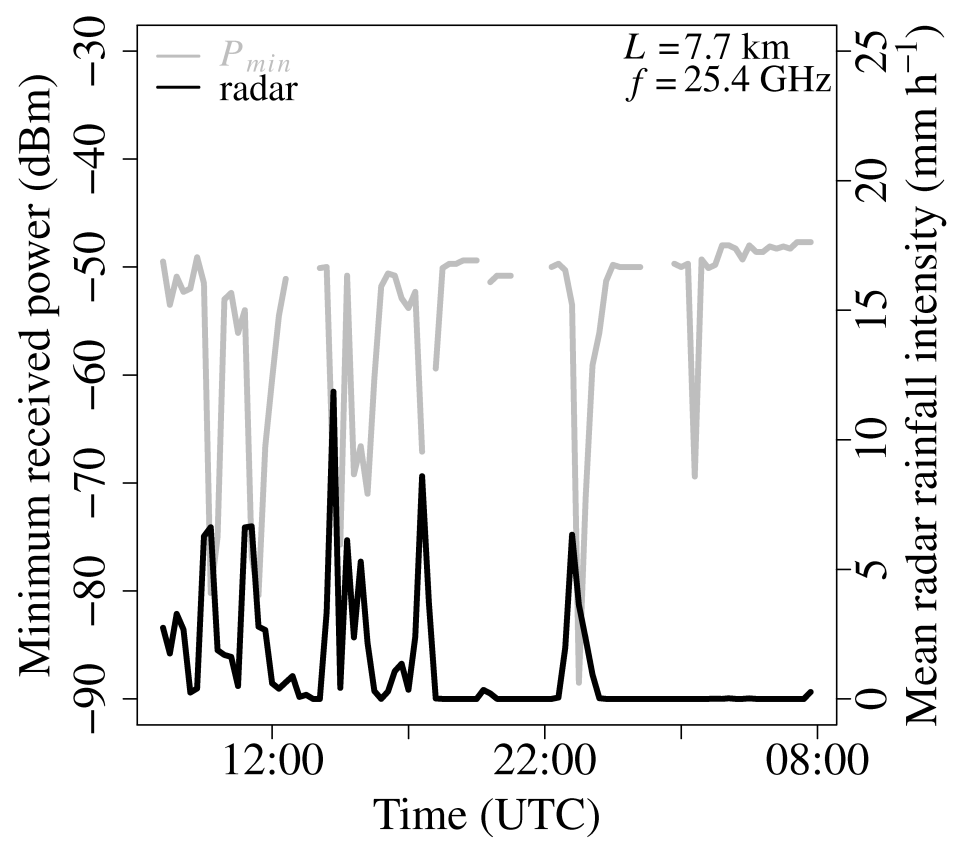
Fig. 4.16 Minimum received powers (gray) from one commercial microwave link and mean gauge-adjusted radar rainfall intensities (black) for a wet day (Metselaar et al., 2022).#
Fig. 4.17 shows the locations of 2000 commercial microwave links in the Netherlands. Derivation of rainfall intensities from these links has been found to make a worthwhile contribution to those obtained from the sparse network of automatic rain gauges. Because these networks cover large parts of the land surface of the Earth and have a high density, microwave links especially hold a promise for measuring rainfall in areas were few or no weather radars or rain gauges are available, such as sub-Sahara Africa (Doumounia et al., 2014) or parts of Asia (Overeem et al., 2021). This would not only allow for obtaining much more detailed rainfall estimates in these areas, but would also pave the way for short-term rainfall forecasting (nowcasting) in the (sub)tropics (Imhoff et al., 2020). CML rainfall estimates can be clearly better than satellite precipitation products (Rios Gaona et al., 2017). Ultimately, satellite and CML data would be combined, taking advantage of the wider spatial coverage of satellite products, which is also relevant from a nowcasting perspective.
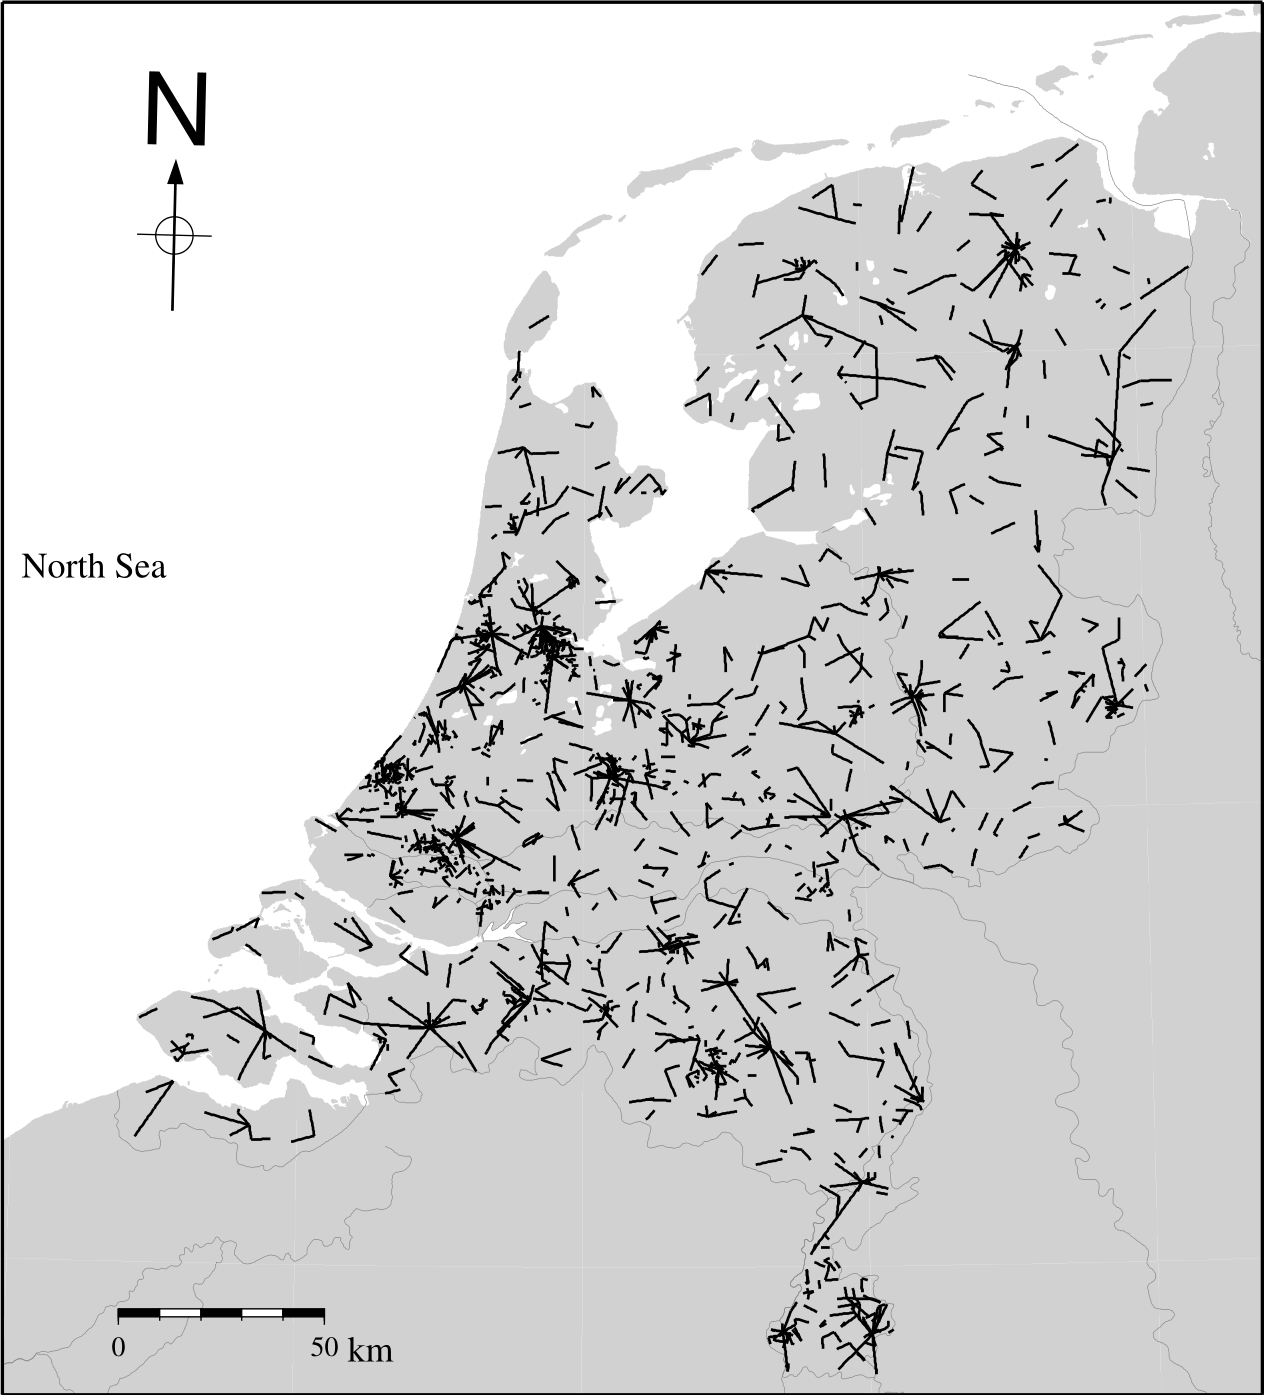
Fig. 4.17 Part of the former cellular communication microwave link network of one mobile network operator in the Netherlands (Metselaar et al., 2022).#
Another advantage of microwave links over rain gauges is that they measure the average rainfall rate over a trajectory instead of at one point. Because hydrologists are often interested in the average rainfall over a whole catchment, line-averaged measurements are in principle preferred over point-measurements as they provide a natural way of spatial integration. Unlike weather radar measurements, observations using microwave links are performed close to the ground (typically at heights of a few tens of meters), exactly where water managers need rainfall estimates.
# Note that the code cells below is used for the website only.
Exercise 4.3
Give 3 factors which cause differences between rainfall measured with radar and microwave links.
Answer Exercise 4.3
Factors include:
The radar measures a large volume, where the microwave link measures over a path and thus a smaller volume.
Radars measure at high altitudes when far away from the radar. Microwave links are established between towers and thus closer to the land surface.
Rainfall estimation errors differ between radar and microwave links.
Exercise 4.4
Why is the coefficient \(\boldsymbol{A_\mathrm{a}}\) subtracted from the received power in (4.4)? How does the coefficient \(\boldsymbol{A_\mathrm{a}}\) change before, during and after a rain storm?
Answer Exercise 4.4
The coefficient \(A_\mathrm{a}\) accounts for ``false’’ attenuation caused by the wet antennas. It can be seen as the loss of received power which is not caused by rainfall. If this amount is neglected, the rainfall rates will be overestimated.
Before the rain storm the antennas are dry and \(A_\mathrm{a}\) is zero. During the rainstorm the antennas become wet and \(A_\mathrm{a}\) increases. After the rainstorm the antennas dry again and \(A_\mathrm{a}\) decreases to zero.
Exercise 4.5
What added value could microwave links have in the Netherlands? And in low- to middle-income countries?
Answer Exercise 4.5
Even in an intensely monitored country like The Netherlands the rain gauge density is low in comparison to the spatial scale of individual rainfall events. The quality of the operational weather radar can be improved by adding microwave link information, in particular far away from the radar. In developing countries with a limited amount of rain gauges and radars, mobile telecommunication is often well established. In these countries microwave links can be the only source of rainfall data.
4.2.5.5. Personal weather stations#
Personal weather stations (PWSs) allow anyone to measure weather variables in their direct environment. Many automatic PWSs can upload their measurements directly to online platforms where they can be visualized and shared. Weather Underground, WOW-NL and the Netatmo Weathermap are examples of platforms where weather observations are visualized in real time. Weather variables can be crowdsourced from such platforms in far higher spatial and temporal resolution than from traditional sensor networks.
The devices are often low cost with a lower measurement accuracy than typical sensors from meteorological institutes. The PWSs are installed by citizens without expert knowledge on sensor placement requirements and/or lacking an available measurement site without interference from surroundings. Hence, many of the PWSs generate compromised measurements. For tipping-bucket rain gauges, obstructions (e.g., insects, twigs) and the device not being completely level with the ground could hinder the tipping mechanism. A shielded location will also lead to underestimation of rainfall. Overestimation of rainfall can result from PWS owners cleaning or handling the device, resulting in tipping-bucket tips, creating measurements of “artificial rain”.
Recent research (De Vos et al., 2020) has shown that PWS measurements tend to underestimate the rain as measured by the reference (gauge-adjusted radar), with some occurrences of large reported rainfall values that are not otherwise captured. Nevertheless, the majority of PWSs seem to agree well with the reference. The spatial distribution of rainfall measured by PWSs is found to correspond to that of the gauge-adjusted radar reference. In summary, PWSs hold a promise for applications in meteorology (e.g. real-time adjustment of radar data) and (urban) hydrology (e.g. flood early warning).
