3.2. Rainfall and evaporation#
Because the Netherlands is a flat country, the spatial differences in average precipitation are small. The wettest areas are the hilly regions in the east and far south, where so-called orographic rainfall occurs. In an extremely dry year, the amount of precipitation does not exceed 400 mm/year, and in an extremely wet year, more than 1,100 mm/year of precipitation may fall (KNMI, n.d.). The average precipitation is 850 mm/year, and the average evaporation is 600 mm/year (KNMI, n.d.). Thus, the precipitation surplus averages 250 mm/year. Since the average evaporation is relatively constant from one year to the next, the annual precipitation surplus in a given year mainly depends on the amount of rainfall. In summer, there is often a precipitation deficit due to limited rainfall and high evaporation. This deficit varies strongly from year to year, and sometimes, a precipitation surplus can occur in an extremely wet summer.
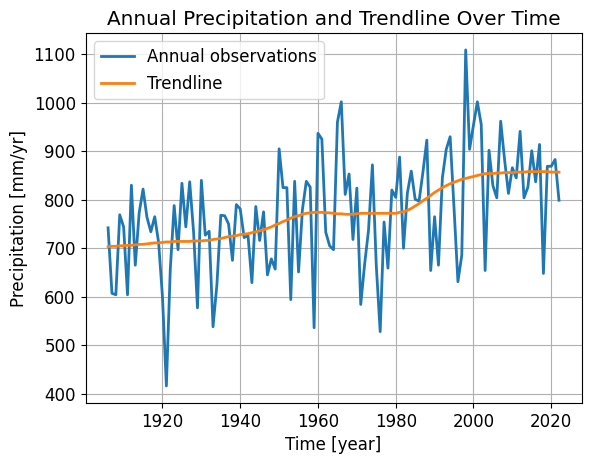
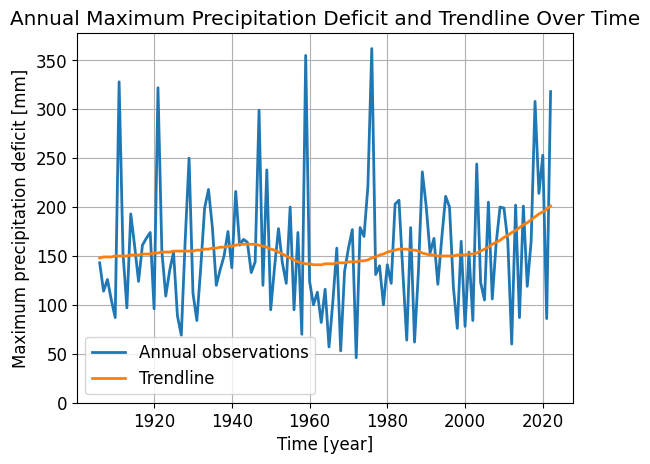
In the Netherlands, KNMI (Koninklijk Nederlands Meteorologisch Instituut) is responsible for monitoring the weather and climate (KNMI, n.d.). Below, the annual sum of observed precipitation and the maximum precipitation deficit for the Netherlands are shown. The data is accessible through the KNMI climate dashboard.
The large variability in annual precipitation is clearly reflected in the precipitation graph, with annual precipitation values between 400 and 1,100 mm/year. The trendline represents the long-term average and indicates a steady increase in annual precipitation since the year 1900. Whereas around the year 1900 the mean annual precipitation was about 700 mm/year, more recent years show a mean annual precipitation of about 850 mm/year. This increase in precipitation is a result of contemporary climate change caused by anthropogenic greenhouse gas emissions. As the atmosphere warms, it can contain more moisture. This particularly effects coastal regions such as the Netherlands, where increased evaporation from seawater contributes to more precipitation.
KNMI has not observed an increase in the number of wet days, but rather an increase in the amount of precipitation per wet day and more extreme showers with larger intensities (KNMI, 2015). In the Netherlands, the increase in precipitation occurs predominantly in winter, whereas summers have, on average, become drier. These differences are expected to become more apparent as global temperatures continue to rise. This is reflected in the precipitation deficit graph as well. Here, the trendline shows an increase in maximum precipitation deficit over time. Since the maximum precipitation deficit usually occurs in summer, the maximum precipitation deficit is expected to increase even more in the future as summers become warmer and drier for longer periods, leading to more evaporation and consequently a larger deficit. In contrast to these extended drier periods in summer, extreme summer showers have also intensified. An example of this are the floods in Limburg (the Netherlands), the Ardennes (Belgium) and the Eiffel (Germany) in July 2021 (TU Delft, 2021). In some areas precipitation rates exceeded 90 mm/day. This resulted in large discharge peaks in the rivers Meuse, Ahr, Geul and Roer, leading to severe flooding in these watersheds (Expertisenetwerk Waterveiligheid, 2021), which caused more than 200 casualties and billions worth of material damage in the region.
Show code cell source
import numpy as np
import matplotlib.pyplot as plt
import pandas as pd
plt.rcParams.update({'font.size': 12, 'lines.linewidth': 2})

# load the data
df_precipitation = pd.read_csv('../datasets/KNMI_climatedashboard_precipitation.csv', delimiter=';', header=0,
                               index_col=['Category'], usecols=['Category', 'Sum','Trendline'],
                               skipfooter=7, engine='python')

# plot the data
df_precipitation['Sum'].plot(xlabel='Time [year]', ylabel='Precipitation [mm/yr]', label='Annual observations')
df_precipitation['Trendline'].plot(xlabel='Time [year]', ylabel='Precipitation [mm/yr]', label='Trendline')
plt.title('Annual Precipitation and Trendline Over Time')
plt.legend()
plt.grid();

Show code cell source
# load the data
df_deficit = pd.read_csv('../datasets/KNMI_climatedashboard_precipitationdeficit.csv', delimiter=';', header=0,
                               index_col=['Category'], usecols=['Category', 'Max_deficit','Trendline'],
                               skipfooter=7, engine='python')

# plot the data
df_deficit['Max_deficit'].plot(xlabel='Time [year]', ylabel='Maximum precipitation deficit [mm]', label='Annual observations')
df_deficit['Trendline'].plot(xlabel='Time [year]', ylabel='Maximum precipitation deficit [mm]', label='Trendline')
plt.title('Annual Maximum Precipitation Deficit and Trendline Over Time')
plt.legend()
plt.grid()
plt.ylim(0);

