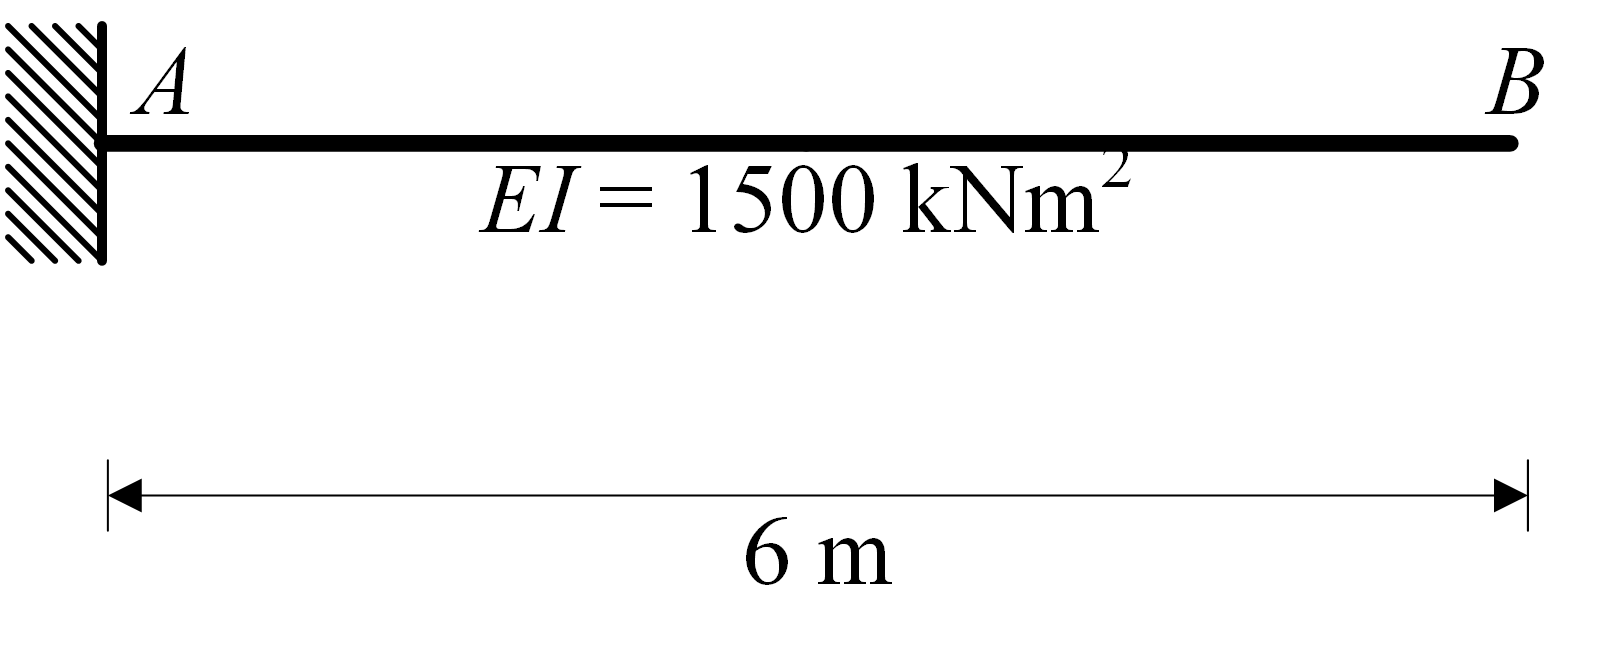
Influence line rotation#
Click –> Live Code on the top right corner of this screen to investigate some influence lines!

import micropip
await micropip.install("ipympl")
import numpy as np
import sympy as sym
import matplotlib.pylab as plt
from ipywidgets import widgets, interact
from matplotlib.patches import Arc,StepPatch

%matplotlib widget
EI, x = sym.symbols('EI, x',real=True)
Av, Am = sym.symbols('Av, Bv',real=True)
a, L= sym.symbols('a, L ',positive=True,real=True)
C1, C2, C3, C4 = sym.symbols('C1, C2, C3, C4')
Find rotation line \(\phi\)#
q = -Am * sym.SingularityFunction(x,0,-2) - Av * sym.SingularityFunction(x,0,-1) + 1*sym.SingularityFunction(x,a,-1)
V = -sym.integrate(q,x)+C1
M = sym.integrate(V,x)+C2
kappa = M / EI
phi = sym.integrate(kappa,x)+C3
w = - sym.integrate(phi,x)+C4
eq1 = sym.Eq(w.subs(x,0),0)
eq2 = sym.Eq(phi.subs(x,0),0)
eq3 = sym.Eq(M.subs(x,-1),0)
eq4 = sym.Eq(M.subs(x,L+1),0)
eq5 = sym.Eq(V.subs(x,-1),0)
eq6 = sym.Eq(V.subs(x,L+1),0)
sol = sym.solve([eq1,eq2,eq3,eq4,eq5,eq6],[C1,C2,C3,C4,Av,Am])
w_sol = w.subs(sol)
w_subs = w_sol.subs([(L,6),(a,2),(EI,1500)])
w_numpy = sym.lambdify([L,a,EI,x],w_sol.rewrite(sym.Piecewise))
phi_sol = phi.subs(sol)
phi_subs = phi_sol.subs([(L,6),(a,2),(EI,1500)])
phi_numpy = sym.lambdify([L,a,EI,x],phi_sol.rewrite(sym.Piecewise))
display(sym.simplify(phi_subs.rewrite(sym.Piecewise)))
plt.figure()
x_plot = np.linspace(0,6,100)
plt.plot([0,6],[0,0],color='black',linewidth=2)
plt.plot(x_plot,phi_numpy(L=6,a=6,EI=1500,x=x_plot),color="blue")
plt.xlabel('$x$')
plt.ylabel('rotation')
axs = plt.gca()
axs.grid()
axs.invert_yaxis()
title0 = 'rotation for force at $x_F =  6 $'
axs.set_title(title0);
plt.show()
\[\begin{split}\displaystyle \begin{cases} - \frac{1}{750} & \text{for}\: x > 2 \\\frac{x \left(x - 4\right)}{3000} & \text{for}\: x > 0 \\0 & \text{otherwise} \end{cases}\end{split}\]
Find influence line \(\phi\)#
q = -Am * sym.SingularityFunction(x,0,-2) - Av * sym.SingularityFunction(x,0,-1) + 1*sym.SingularityFunction(x,a,-2)
V = -sym.integrate(q,x)+C1
M = sym.integrate(V,x)+C2
kappa = M / EI
phi = sym.integrate(kappa,x)+C3
w = - sym.integrate(phi,x)+C4
eq1 = sym.Eq(w.subs(x,0),0)
eq2 = sym.Eq(phi.subs(x,0),0)
eq3 = sym.Eq(M.subs(x,-1),0)
eq4 = sym.Eq(M.subs(x,L+1),0)
eq5 = sym.Eq(V.subs(x,-1),0)
eq6 = sym.Eq(V.subs(x,L+1),0)
sol = sym.solve([eq1,eq2,eq3,eq4,eq5,eq6],[C1,C2,C3,C4,Av,Am])
w_sol = w.subs(sol)
w_subs = w_sol.subs([(L,6),(a,6),(EI,1500)])
w_inf_numpy = sym.lambdify([L,a,EI,x],w_sol.rewrite(sym.Piecewise))

display(sym.simplify(w_subs.rewrite(sym.Piecewise)))
plt.figure()
x_plot = np.linspace(0,6,100)
plt.plot([0,6],[0,0],color='black',linewidth=2)
plt.plot(x_plot,w_inf_numpy(L=6,a=6,EI=1500,x=x_plot),color="blue")
plt.xlabel('$x_F$')
plt.ylabel('Influence factor rotation')
axs = plt.gca()
axs.grid()
axs.invert_yaxis()
title0 = 'Influence line for rotation at $x_w =  6 $'
axs.set_title(title0);
plt.show()
\[\begin{split}\displaystyle \begin{cases} \frac{3 - x}{250} & \text{for}\: x > 6 \\- \frac{x^{2}}{3000} & \text{for}\: x > 0 \\0 & \text{otherwise} \end{cases}\end{split}\]
Comparison displacement with \(\phi\) and influence line for \(\phi\) at \(x = ...\)#
x = np.linspace(0,6,100)
fig, axs = plt.subplots(2, 1, figsize=(7, 6))
def func(a,b):
    axs[0].clear()  # Clear the existing plot
    axs[1].clear()
    axs[0].plot([0,6],[0,0],color='black',linewidth=2)
    axs[0].grid()
    axs[0].plot(x,w_numpy(6,b,1500,x),color='blue')
    axs[0].plot([a-0.4,a,a+0.4],[w_numpy(6,b,1500,a)+phi_numpy(6,b,1500,a)*0.4,w_numpy(6,b,1500,a),w_numpy(6,b,1500,a)-phi_numpy(6,b,1500,a)*0.4],linewidth=3)
    axs[0].plot([a-0.4,a,a+0.4],[w_numpy(6,b,1500,a),w_numpy(6,b,1500,a),w_numpy(6,b,1500,a)],color='black')
    if phi_numpy(6,b,1500,a) > 0:
        axs[0].annotate(text='', xytext=(a+0.5,w_numpy(6,b,1500,a)), xy=(a+0.5,w_numpy(6,b,1500,a)-phi_numpy(6,b,1500,a)*0.5), arrowprops=dict(arrowstyle='simple',connectionstyle="arc3,rad=.5"))
    else:
        axs[0].annotate(text='', xytext=(a+0.5,w_numpy(6,b,1500,a)), xy=(a+0.5,w_numpy(6,b,1500,a)-phi_numpy(6,b,1500,a)*0.5), arrowprops=dict(arrowstyle='simple',connectionstyle="arc3,rad=-.5"))
    axs[0].annotate('%.5f rad' % phi_numpy(6,b,1500,a),xy = [a+0.6,(w_numpy(6,b,1500,a)+w_numpy(6,b,1600,a)-phi_numpy(6,b,1500,a)*0.3)/2])
    axs[0].annotate(text='', xy=(b,0), xytext=(b,-0.01), arrowprops=dict(arrowstyle='simple'))
    axs[0].set_ylim([-0.009,0.05])
    axs[0].invert_yaxis()
    title0 = 'Rotation for force at at $x_F = '+str(b)+'$, showing rotation at $x_w = '+str(a)+'$'
    axs[0].set_title(title0)
    axs[1].plot([0,6],[0,0],color='black',linewidth=2)
    axs[1].grid()
    axs[1].plot(x,w_inf_numpy(6,a,1500,x),color='blue')
    axs[1].plot(b,w_inf_numpy(6,a,1500,b),marker='o')
    axs[1].annotate('%.5f rad' % np.round(w_inf_numpy(6,a,1500,b),5),xy = [b,w_inf_numpy(6,a,1500,b)-0.00005])
    axs[1].set_ylim([-0.013,0.001])
    axs[1].invert_yaxis()
    title1 = 'Influence line for displacement at $x_w = '+str(a)+'$'
    axs[1].set_title(title1)
    axs[0].spines['right'].set_color('none')
    axs[0].spines['top'].set_color('none')
    axs[0].spines['bottom'].set_position('zero')
    axs[0].spines['left'].set_position('zero')
    axs[1].spines['right'].set_color('none')
    axs[1].spines['top'].set_color('none')
    axs[1].spines['bottom'].set_position('zero')
    axs[1].spines['left'].set_position('zero')
    plt.draw()

interact(func, a = widgets.FloatSlider(min=0, max=6, value=2, step=0.1, description="Location rotation x_phi = ... (m)",readout_format='.1f',style= {'description_width': '250px'},layout = {'width': '500px'}),
         b = widgets.FloatSlider(min=0, max=6, value=2, step=0.1, description="Location force x_F = ... (m)",readout_format='.1f',style= {'description_width': '250px'},layout = {'width': '500px'}) );
